Weekly Economic Digest for 9-1-23: Employment; Personal Income and Expenditures; and GDP
The views and opinions expressed in this post are solely those of the author and do not necessarily reflect the views of the Georgia Institute of Technology or the Georgia Board of Regents.
The major economic data releases this week were the Job Openings and Labor Turnover Survey (JOLTS), the monthly employment situation, personal income, personal consumption expenditures, and revisions to Gross Domestic Product (GDP) for the second quarter of 2023.
Gross Domestic Product (GDP)
Gross Domestic Product (GDP) is the market value of all the finished goods and services produced within a country’s borders in a specific time period. As such, it functions as a comprehensive scorecard of a country’s economic health.
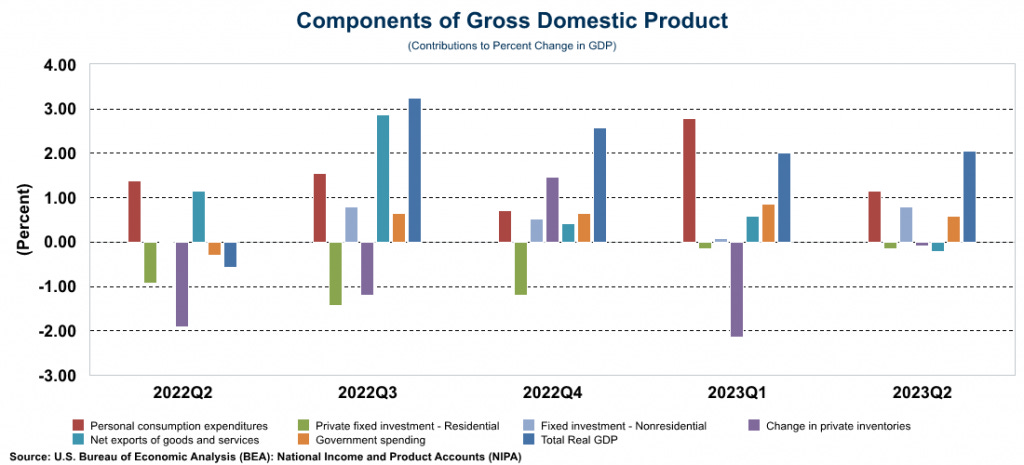
Revisions to the initial estimates of second quarter GDP were released this week and the data was revised down to 2.1% growth for the second quarter. The "advanced" estimated published last month was 2.4%. However, the GDP estimate released this week is based on more complete source data than was available last month.
The components of GDP (graph below) show that in the second quarter, the largest contributor to the growth was personal consumption as consumers are still finding a way to spend money despite stagnant wages and depleted savings. Not surprising, residential fixed investment continues to be a drag on the economy (as it has been for the past several quarters) as do inventories as businesses continue to burn through the inventories they built up in response to the supply chain issues that occurred during COVID.
Personal Income and Consumption
The fact that consumers are still spending and contributing to overall economic output continues to amaze. Adjusted for inflation, average wages declined for 26 consecutive months before post two very modest gains for the last two months.
Even so, through out the entire period, consumers continued to spend by using their credit cards and significantly increasing their level of debt. Below is the same graph but it adds the growth in consumer revolving credit. During the 26-month period of declining real wages, consumers were growing their revolving debt balances by double digits.
Consumers continue to simply "put it on the card." According to a JD Power Survey, 51% of US credit card holders now carry a revolving debt balance. In other words, more people are carrying a balance from month-to-month than are paying off their cards. (Among those classified as "financially unhealthy" that number jumps to 69%.) And the average balance is $2,573 which is up 6.5% from a year ago. All the savings from the pandemic stimulus is gone and consumers are having to rely on credit cards for their every day expenses. For the past two months, real personal consumption expenditures have grown while real disposable income has not.
Total US credit card debt is now above $1 TRILLION. Not surprisingly, as consumption rises faster than income, the savings rate has declined to 3.5%, the lowest level since November 2022.
Personal Consumption Expenditures Index (PCE Inflation)
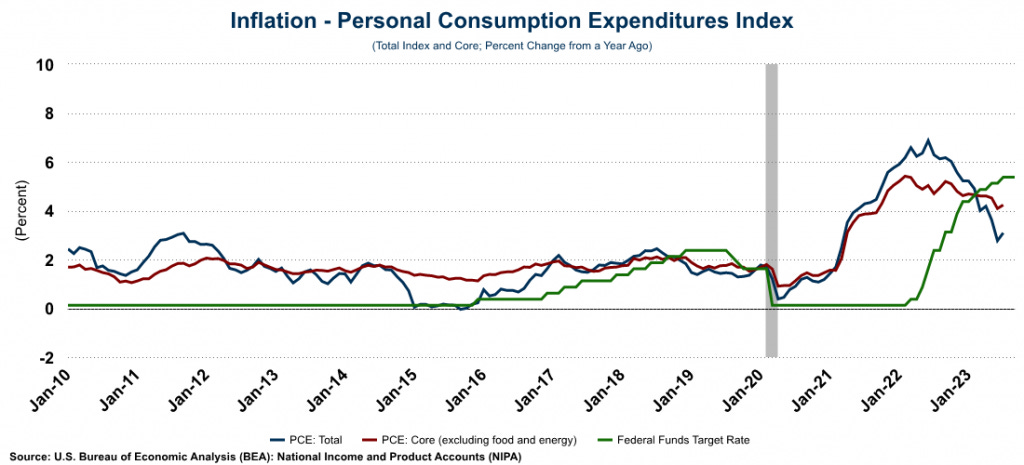
Also this week, the Personal Consumption Expenditures Index (PCE) was released. The PCE measures price changes in consumer goods and services exchanged in the U.S. economy. The PCE differs from CPI in that the CPI measures the price changes in a fixed basket of goods while the PCE measures the changes in the price of goods actually purchased by consumers. This is an important distinction because as consumers change their buying behavior, the inflation that they actually experience changes. The PCE takes this into account as it looks at how much households are spending and what they are spending their money on. As such, it covers a lot more of the US economy. Because of this, PCE is considered to be the Federal Reserve’s preferred inflation gauge when evaluating the economy and how inflation is running compared to their policy target.
As shown in the graph below, PCE inflation ticked up in July to 3.1%. While it is well below its peak of 6.9% in June of 2022, it is still well above the Fed's policy target of 2% and in July, it moved in the wrong direction. Core PCE (i.e., excluding food and energy prices) also ticked up to 4.2%. It will be interesting to watch both these measures as the Fed Funds rate is now well above both levels which suggests that the inflation rates should be moving down. The Fed can't be happy that July's numbers both increased and it suggests that yet more rate hikes are on the horizon.
While the over all PCE index shows significant inflation, the components of the index tell an interesting story. US consumers purchase a lot of services and the PCE for services actually ticked up to 5.2%. However, the PCE for goods has been in DEFLATIONARY territory for 2 consecutive months and posted annual price declines of 0.5% in July.
Labor Market
Finally, this week's commentary ends with a look at the labor market through the Job Openings and Labor Turnover Survey (JOLTS) and the August employment report that was released this morning. According to the Bureau of Labor Statistics, the economy added 187K payroll jobs in August. It is important to note that the two previous months were revised DOWN 100K jobs. "Payroll" jobs are based on what is called the “establishment” or “payroll” survey. It measures employment, hours, and earnings in the nonfarm sector and is based on jobs on industry payrolls. There is another measure of employment known as the “household” survey. It is designed to measure the labor force status of the civilian noninstitutional population and data from this survey is used to calculate the labor force and the unemployment rate. Obviously, because these surveys are measuring different things, they are going to be different on a month-to-month basis. However, one would expect that they move in roughly the same direction. When they move in direct opposition to one another, it raises questions about the status of the labor market. In July, household employment grew by 222K.
Again, because these surveys measure different things, the levels of employment are different. Because there are a lot of self-employed people, the household survey level of employment is higher than the establishment survey. However, the usually move in tandem with one another. Starting in March of 2022, they two surveys began to diverge. Many more jobs were being reported on the establishment survey than were being reported on the household survey.
This occurred because people were taking on additional jobs. When a person takes a second job, a new job shows up on payrolls, but the number of households reporting being employed doesn't change. A closer look at the number of new full-time vs. part-time jobs confirmed this phenomena. In fact, for the past two months, despite the increase in payroll employment, the number of households reporting being employed full-time has actually declined while the number of new part-time jobs is up by nearly 1 million! In short, not all payroll jobs are equal....a part-time jobs looks the same as a full-time job on the establishment survey, so it is important to dig a little deeper than just the headline numbers.
Overall, it is clear that the labor market in the US is weakening. The number of new payroll jobs being added each month is clearly trending down which is easy to see if you look at it on a moving-average basis (graph below.) This is exactly what the Fed is trying to accomplish with their series of rate hikes.
Further evidence of this weaking is the fact that the unemployment rate ticked up in August to 3.8% which is the highest it has been in 18 months. This is because more people are getting back into the labor force as savings run out and costs continue to rise. The labor force participation rate ticked up to 62.8 percent...the highest it has been since before COVID.
However, not everyone is jumping back into the labor force. Many of those who left during COVID in the 55+ age range have stayed out. The participation rate for that age group has increased over the last two months, but it is still well below pre-COVID levels. However, for those in the prime-age working group (25-54 years old) the participation rate is well above pre-COVID levels.
The final piece of evidence released this week of a tightening labor market was the Job Openings and Labor Turnover Survey (JOLTS). The number of posted job openings declined for the third consecutive month and now stands at 8.8 million. That is still significantly higher than the number of people who are unemployed (6.4 million). At one point there were 2 job openings for every unemployed person. Now that ratio is down to 1.4. However, it is important to note that the data can be a little misleading. If one job is posted on three different, unrelated job boards, that counts as three separate job openings even though there is only one actual job available! Be careful when comparing job openings to the number of people unemployed! But even so, the trend in job openings is clearly moving down.
Lastly, the "quit rate" (i.e., the number of people quitting their job as a percent of total employment) dropped to 2.3%...roughly where it was pre-COVID. Again, as savings run out; credit card balances explode; real wages decline; and there are fewer jobs to be had, people are far less likely to quit their current job. It appears as if the policies being implemented by the Fed are starting to have an impact. Now let's just hope they don't go too far...assuming they haven't already.


