
Weekly Economic Update 05-09-25: April Employment; Factory Orders; ISM Manufacturing & Services; and Consumer Credit
April employment shows little sign of damage from the trade war.
The views and opinions expressed in this post are solely those of the author and do not necessarily reflect the views of the Georgia Institute of Technology or the Georgia Board of Regents.
Tax incidence and demand elasticity. The more I talk to people, the more it becomes apparent that this is an economic concept that many simply do not understand. All we hear recently from the media is how “tariffs are a tax on the American consumer.” It is true that tariffs are a tax. And, further, it is true that the American consumer will pay SOME of that tax. But certainly, not all. How much will be paid by consumers is determined by the demand elasticity of each individual product.
I was recently making a purchase directly from a company in China. They suspended their sales to America so that they could “evaluate the impact of U.S. trade policy.” The product in question was going to be subject to significant tariffs. When they restarted sales to the U.S., despite a huge tariff burden, the price to the consumer went up roughly 10%.
Two points to make here. First, remember that the tariff is calculated based on the declared value of the product when it enters the country, which is typically the price paid by the importer. As such, the tariff is applied before any markups or additional costs related to distribution, wholesale, and retail are factored in. So, if a good that was imported for $20 but sells retail for $100 is faced with a 145% tariff, that tariff is $29, not $145. So now, the question becomes, how much of that additional $29 will be passed on to the consumer? Will the price rise to $129 or something less?
That leads to the second point. The answer to that question depends on the demand elasticity of the item relative to supply. Demand elasticity is a measure of the extent to which the quantity demanded changes with price. If a product has inelastic demand, the change in the quantity demanded due to a change in price will be small. These would be items that you absolutely have to have, i.e., life-saving medication or critical electronic components. If a product has a demand curve that is less elastic than supply, the consumer will pay more of the tariff than the seller/producer (see below).
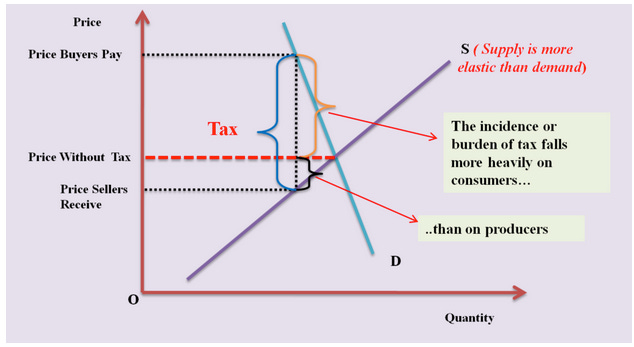
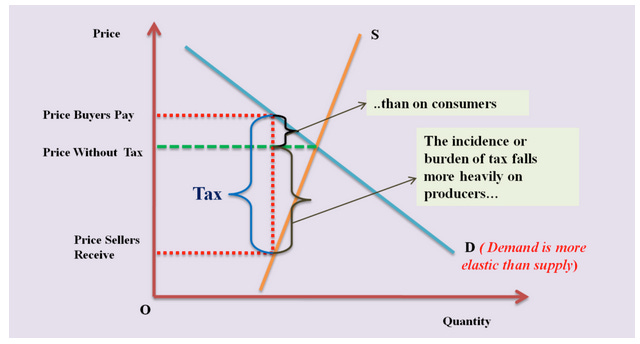
Conversely, for a product with highly elastic demand, the change in the quantity demanded due to a change in price will be large. These would be items that you really don’t need….more like wants. Items like toys, high-end hand bags, and e-readers. If a product has a demand curve that is more elastic than supply, the producer/seller will pay more of the tariff than the consumer (see below).
This is why many tariffs on computer chips, medicine, and other necessary items are often “suspended.” Those tariffs would mostly be paid by consumers. It is the items with high elasticity that are going to be subject to the highest tariffs. And for most of these items, the consumer has a choice. They are “wants," not “needs.” If, like me, you choose to make the purchase anyway, yes, you are paying part of the tariff. But you are not paying the bulk of it. And this is why China’s economy is tanking and their central bank had to lower rates and flood their economy with liquidity this week.
April Employment
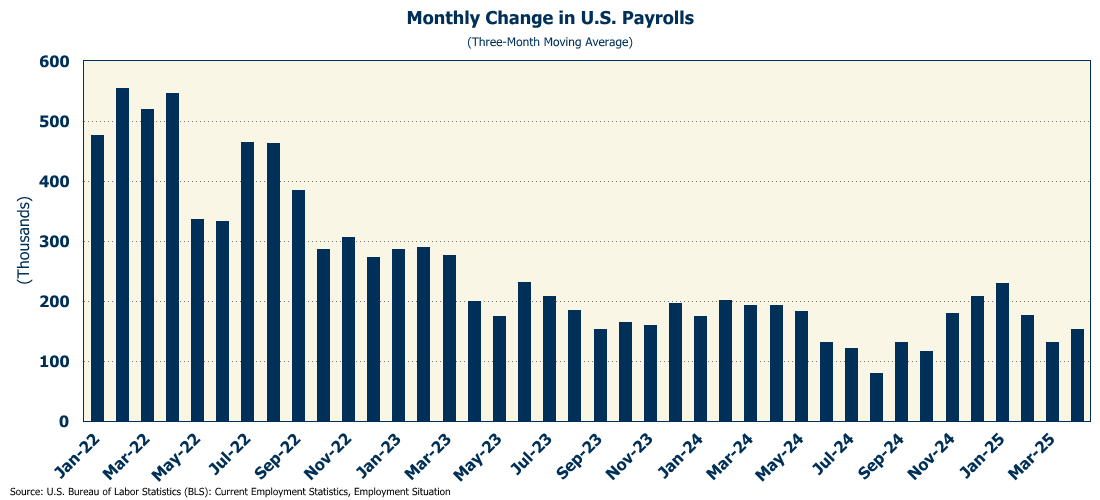
It is week-old news now, but I promised last week I would report on the April employment numbers that came out last Friday morning. Bottom line….the number came in much stronger than expected, with 177K new jobs added in April (full release here). On a three-month moving average basis, employment reversed trend and moved up in April. (The three-month moving average is useful as it incorporates any revisions to previous months.)
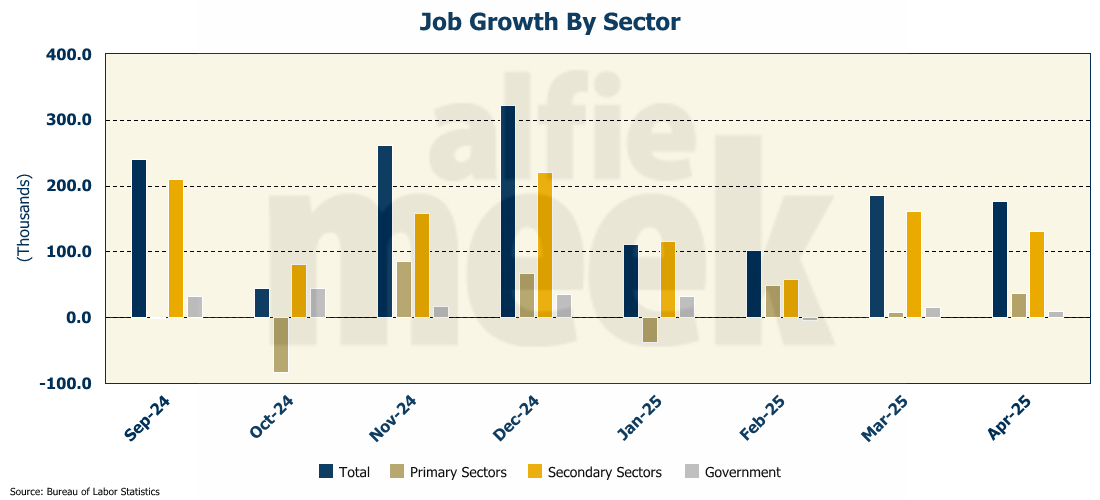
Digging deeper into the report, it appears that primary sectors represented a larger chunk of the employment than has been the case in the recent past. Primary sectors added nearly 37K jobs, or 20.8% of the total jobs growth in April. Last year, healthcare and government represented two-thirds of employment growth. That share is moving down, albeit slowly. Over the past 12 months, the government has accounted for 17% of the total job growth, while primary sectors such as manufacturing, wholesale trade, finance, and professional services have only accounted for about 1%. However, in April, the government represented only 5.6% of the job growth, and ALL of that was state & local governments as the Federal government lost 9,000 jobs due to DOGE.
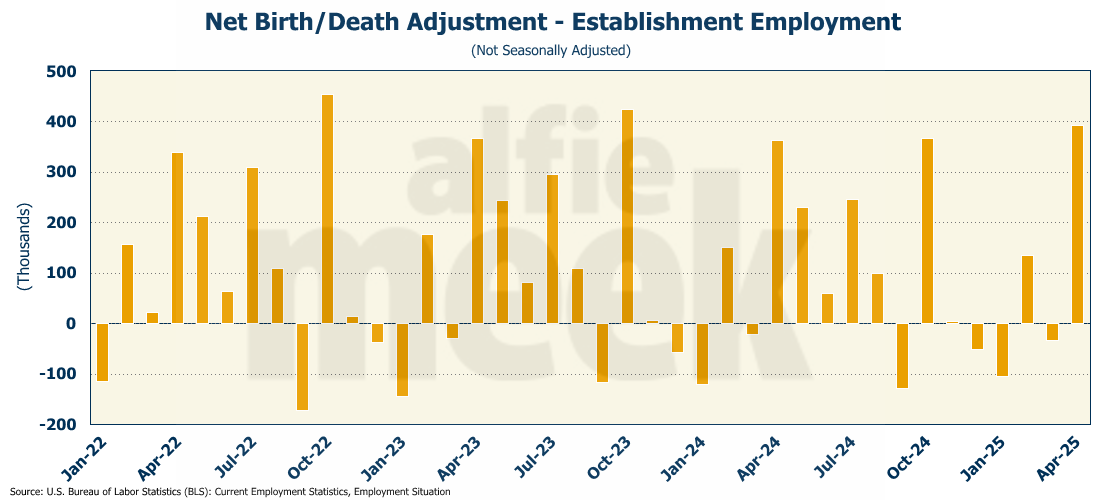
One concern with the data is the extent to which the “birth/death model” contributed to the increase. For those who may not be familiar, the birth/death model is used to estimate the net number of jobs in a given period that have been created by new businesses (“births”) or lost to business closings (“deaths”). The purpose of the model is to adjust for the unavoidable lag between an establishment opening for business and its inclusion in the monthly establishment population which then makes it available for the survey sampling.
It is important to note that the birth-death forecast estimates are not seasonally adjusted, and are applied to the not seasonally adjusted monthly employment estimates. Then, the final employment estimate IS seasonally adjusted. In April, the birth/death model added 393K jobs to the estimate, bringing the total new job estimate to 905K (not seasonally adjusted). In other words, 43% of the job growth in April was derived from model estimations. Of those 393K jobs from the birth/death model, 126K were in professional services. It makes you wonder if, rather than representing real new jobs, people were setting up S corporations and getting Employment Identification Numbers in order to do a little consulting on the side.
However, the household survey actually lends a little credibility to the birth/death model, posting an increase of more than 436K jobs, the large majority of which (300K+) were full-time. That is a significant change from what we have seen over the past several years, where the bulk of the new jobs have been part-time.
Despite this increase in household employment, the unemployment rate remained unchanged at 4.2%, but that is because a lot of people jumped back into the labor force. The labor force participation rate rose to 62.6%.
Bottom line…this report was not the disaster that was expected, and it sure doesn’t show any damage (yet) from the administration’s trade policies. However, the reliance on the birth-death model for nearly half of the new jobs is cause for a little skepticism.
Factory Orders
There was both some “hard” and “soft” data on the manufacturing sector this week. The “soft” data was from the ISM manufacturing survey (reported on below). The “hard” data was from the Census Bureau report on factory orders (full release here). The “hard” data came in fairly strong with growth of 4.3% month-over-month, and 6% over one year ago.
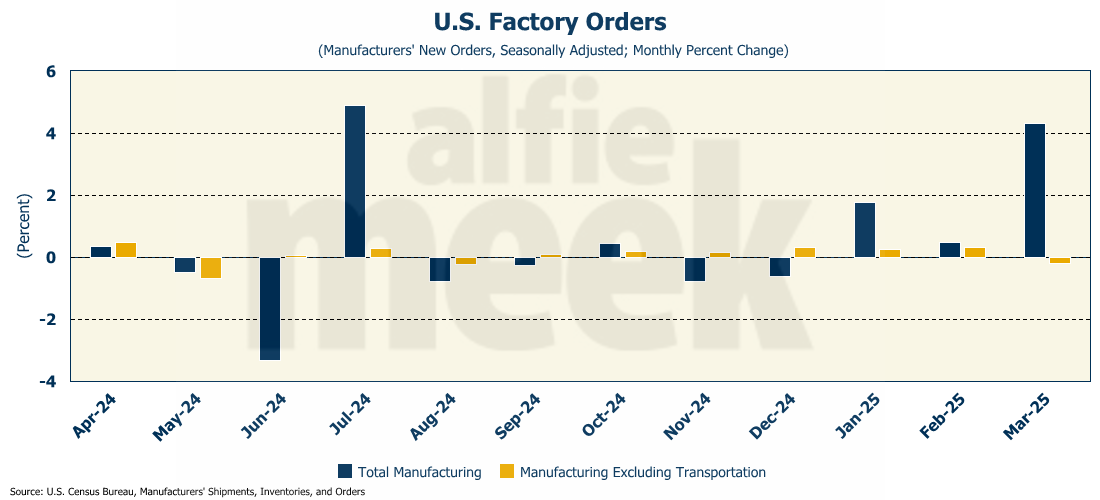
However, orders excluding transportation orders fell 0.2%, suggesting that, perhaps, there was a little “pull forward” of demand for planes and auto parts. The April data will be a better gauge of the impact that trade policy is having on the manufacturing sector.
ISM Manufacturing
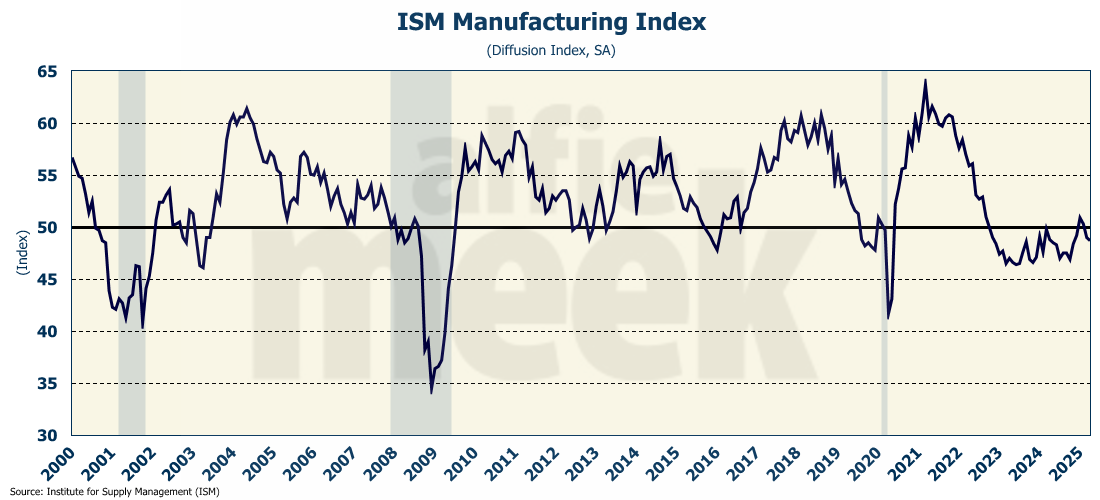
While it may not be showing up in the “hard” data, the impact of trade policy is certainly showing up in the “soft” survey data. The ISM Manufacturing survey fell for the third consecutive month in April to 48.7 (full release here). As a reminder, this is a diffusion index, so any reading below 50 means that the sector is contracting.
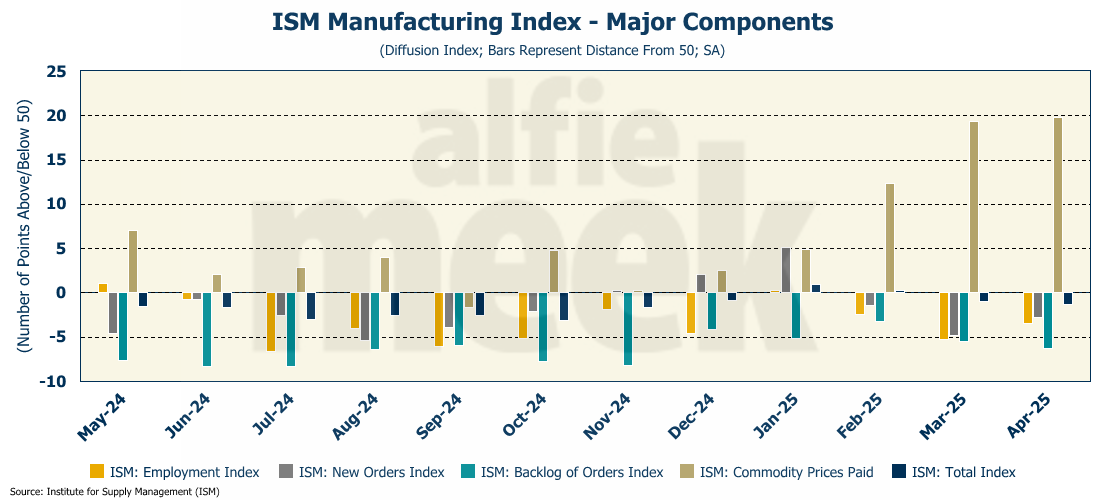
A look at the individual components shows where purchasing managers expect the trade policy impact to occur…commodity prices paid. The sub-indices for new orders, backlog of orders, and employment are all negative for the third consecutive month. But the “prices paid” index is up for the fifth consecutive month, and rose to the highest level since June 2022 when actual inflation peaked at 9.0%. Manufacturers are expecting significantly higher prices in the near future.
ISM Services
If manufacturers are concerned, the same can’t be said for the service sector. Surprisingly, the ISM Services index rose in April to 51.6 (full release here). Expectations were for a slight decline.
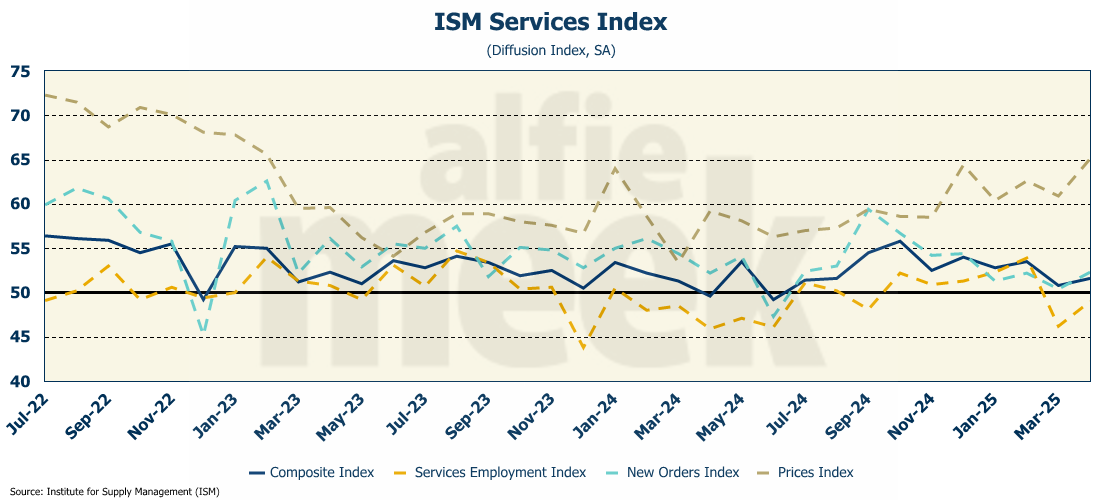
The employment index was still below 50, but moved up, as did the new orders index. However, as was the case with the manufacturing index, the “prices paid” index moved higher as the sector is also expecting an increase in prices in the coming months.
Consumer Credit
Lastly, this week we got an update on consumer credit, which rose $10.2 billion in March (full release here). Most of the increase was in non-revolving debt, which grew by $8.3 billion, the second-highest monthly increase since last July.
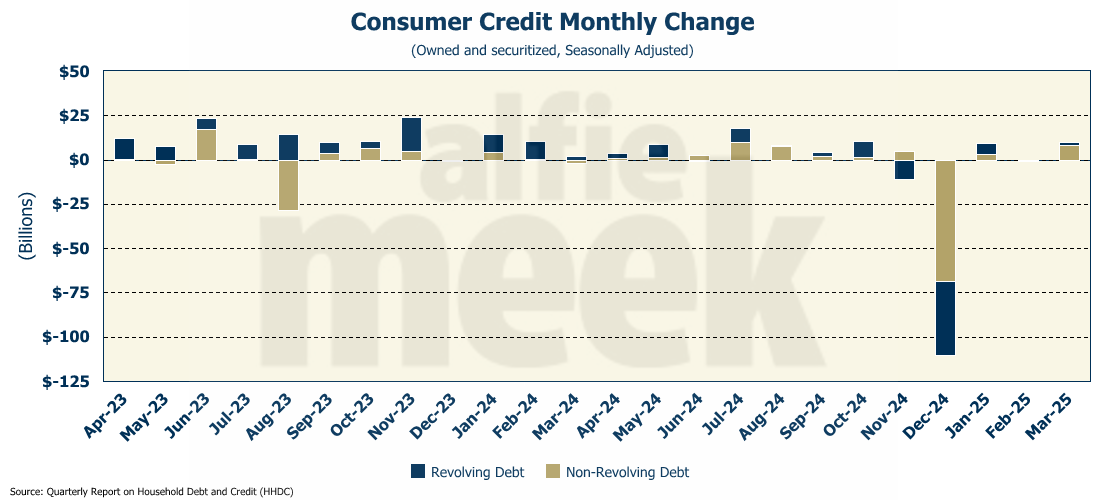
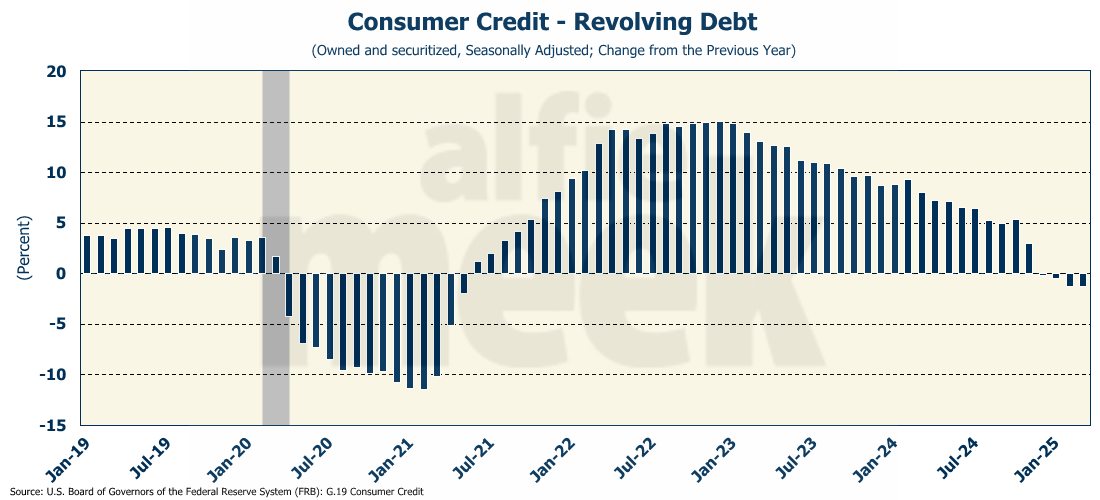
Revolving debt was up only $1.9 billion for the month. That represents a decline of 1.2% from a year ago, and was the fourth consecutive month of annual declines. It seems the capacity for consumers to put their spending on a credit card may finally be exhausted.
The bigger story, however, is that first-quarter student loan debt jumped $22 billion to a total of $1,797 billion (nearly $1.8 trillion), which is a new all-time high. In fact, student loan debt was the major driver of the increase in consumer credit in the first quarter since auto loans shrank by $10 billion. With the new administration determined to begin collecting on these loans, and widespread defaults occurring as millions can’t afford to pay, the hit to consumer spending in the coming months should be noticeable.
One More Thing…
Happy Mother’s Day to all the moms out there! I hope you have a blessed day with your children (and possibly grandchildren). Being a mom is a tough job, and all too often, one that doesn’t get enough recognition. Thanks for all you do day in and day out!
Finally, this week, I want to thank all my “bronze” level members who subscribe for just $8/month. Dave Gmeiner, Colin Martin, Brad Wood, Carlos Alvarez, Steve Goins, Tommy Jennings, Chad Teague, Andrew Imig, Adam Hayes, Kimble Carter, John Mooney, and someone with a “GTwreck” e-mail! Thanks for all your support!
I also have a few supporters who have chosen the monthly option - Rope Roberts and Sarah Jacobs. Thank you all for your monthly support!
As I do each week, I want to invite you to join this group and click/scan the QR code below to join or just “buy some coffee” in support of this weekly update.