Weekly Economic Update 05-31-24: Case-Shiller; Consumer Confidence; PCE Inflation; Personal Income & Spending; and Revised GDP
The views and opinions expressed in this post are solely those of the author and do not necessarily reflect the views of the Georgia Institute of Technology or the Georgia Board of Regents.
Heraclitus, the ancient Greek pre-Socratic philosopher, is credited with saying "the only constant in life, is change." Never were his words more applicable than with current day U.S. government economic statistics.
Now it is just getting ridiculous.
I want to you look at this graph from last week's update:
Notice how the median price for a new home peaked in October 2022 at about $481K? Now look at the same graph downloaded today:
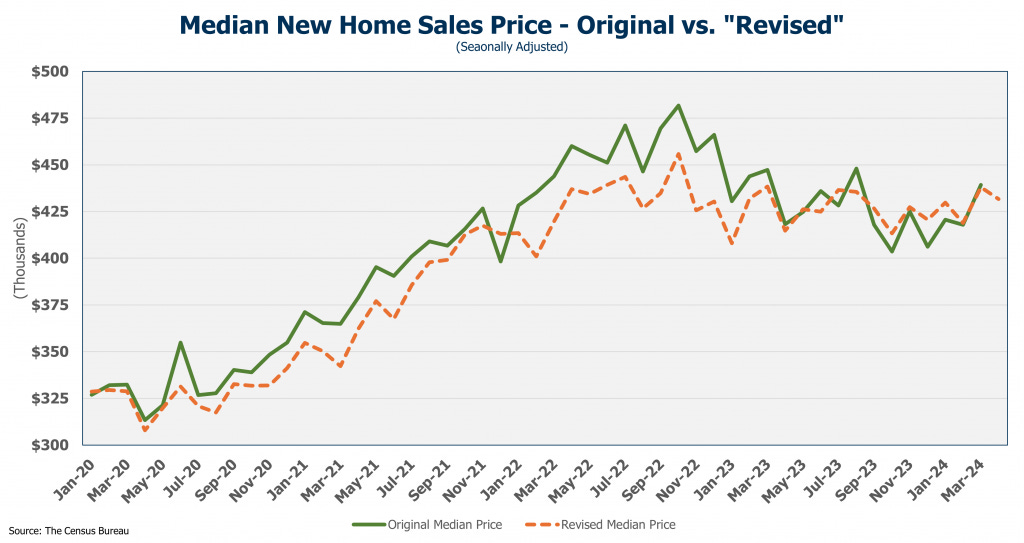
Notice anything different? How about the fact that home price peak in October 2022 is now only $455K! What?!? This required some digging.
It appears that the Census Bureau came to the conclusion that their pricing data got totally messed up during the pandemic and needed to be "fixed." So, at the end of last week, right before the long Memorial Day weekend when they thought no one would notice, they announced HUGE revisions to their median new home price data going back to 2020. These changes were made across three time frames:
April 2020 through January 2023 - ALL median prices were revised down & new seasonal adjustments
February 2023 through December 2023 - Median prices were not revised at all (just seasonal adjustment changes)
January 2024 through March 2024 - ALL median prices were revised up & new seasonal adjustments
The graph below shows the scale of the revisions.
What is interesting about these revisions is that they applied only to PRICE. They didn't make any changes to the house characteristics like size or type. This is the same housing survey. They didn't significantly revise the number of homes being built, or how many were sold or were for sale. These are the same homes they used previously, only now, the median price is much lower...FOR THE SAME HOUSES! In short, for the period 2020-2022, roughly 20%-25% of the pandemic price spike was just wiped out. Poof! Gone! Didn't really happen. Never mind that Federal Housing Finance Agency (FHFA) data shows the spike in appraised values and never mind that mortgage transaction data show the spike in prices. It never happened.
Again, as I say all the time, revisions are a way of life for economists and those that use this type of data. But revisions like this make it very difficult to 1) analyze the state of the economy with any level of confidence and 2.) trust anything that the government says! And in a time when trust in the government is at an all-time low, they aren't doing themselves any favors.
Case-Shiller Home Price Index
Another indicator of home prices that did NOT get "revised" is the Case-Shiller Home Price Index. For the 20 major metros they track, it rose again in March for the 13th consecutive month and is up 7.4% year-over-year. The national index also rose in March and is up 6.5% from one year ago.
On a regional basis, none of the 20 major metro have seen a monthly decline this year. San Diego had the fastest annual growth in March posting 11.1% while Portland was the slowest at 2.2% in March. But again, the point here is that EVERY major city is seeing price increases. With mortgage rates hovering around 7% and limited supply coming on the market, housing affordability continues to be an issue nationwide.
Consumer Confidence
Despite housing affordability continuing to be an issue, and after dropping to one of the lowest levels in more than a decade, consumer confidence about the future rose slightly in May. Confidence in the present economic situation also rose in May. Both of these measures had declined for the previous three months.
Frankly, these increases are a little surprising when you start looking at some of the sub-components of the survey. For example, when considering the present situation, the share of people who believe "jobs are plentiful" is clearly on a downward trajectory and declined again in May to 37.5% (blue line below). The share of people who are planning on taking a foreign vacation (gray line); purchase a car (green line); or purchase a home (red line) all fell in May, or at best, were flat. The only sub-component that rose were those planning on purchasing a major home appliance (yellow line).
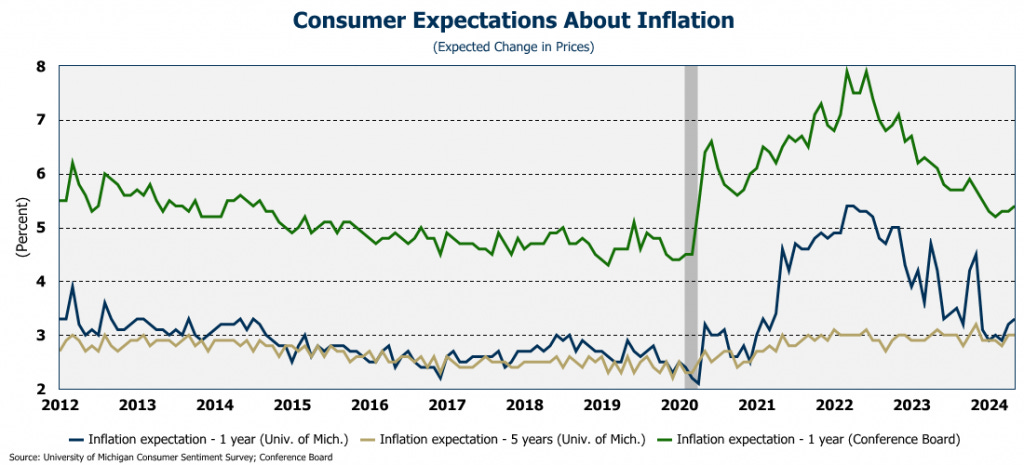
As to consumer confidence in the future, the increase is also surprising because consumers expect significantly higher inflation one year from now - 5.4% - far more than was suggested by the University of Michigan inflation expectations survey. In addition, 56% of the respondents expect interest rates to be higher 12 months from now. Both of those numbers are UP from April, so it is hard to understand why consumer confidence in the future improved in May.
PCE Inflation
PCE inflation came in right at expectations for April falling slightly to 2.6%. Core PCE (less food and energy) was slightly lower at 2.8%. In fact, core PCE inflation is now the lowest it has been since April 2021. And finally, PCE service inflation fell slightly to 3.9%.
On a year-over-year basis, PCE inflation appears to be improving. And that is, of course, what you will hear across all the popular media outlets. However, if you annualize the change over the past 6 months, the rate is 3.2%. If you annualize just the past 3 months, the rate rises to 3.5%. So yes, for the month of April the PCE dropped, but for the past 3 months, the annualized rate higher than at any time in the second half of 2023. We need several months like April to turn the inflation trend.
I often get asked why PCE is consistently lower than CPI. The answer is simple. CPI measures the price changes of a fixed basket of goods. However, PCE measures what people actually buy, and people substitute cheaper items for more expensive ones when prices rise faster than their income. For example, when the price of steak rises relative to income, people switch to chicken. The CPI basket continues to track the price of the steak while the PCE basket substitutes the steak for chicken.
This is why the Fed says they prefer the PCE…because it tracks the prices of "what people actually buy." The problem with that, is that people may be buying that stuff because they can't afford anything else! What happens when chicken gets too expensive and they start eating wall paper paste? If the price of wall paper paste is flat, then the PCE would be flat and the Fed would declare that there was no inflation! Never mind the fact that people are having to eat wall paper paste because that is all they can afford!
Personal Income & Spending
And what people can afford is certainly becoming an issue as their incomes are not keeping up with inflation. On a nominal basis (i.e., not adjusted for inflation) both consumption and income slowed significantly in April growing 0.2% and 0.3% respectively. The personal savings rate (personal saving as a percentage of disposable personal income) remained steady at 3.6% - far lower than the pre-COVID level. Tough to save when prices are growing faster than your income.
However, once you adjust for inflation, both consumption and disposable personal income declined in April. In other words, once you adjust for inflation, consumers both spent less, and earned less, in April than they did in March. Not a great start to the second quarter of 2024.
First Quarter 2024 GDP (Revised Estimate)
We got the first revision of first quarter GDP this week and it showed that the economy was slower in the first quarter than was originally reported (in other words...it was revised down.) Originally reported at 1.6% growth, the Bureau of Economic Analysis has now lowered that number to 1.25%. The main cause of the revisions? Consumer spending was much slower than originally reported. Consumers are having to dig into their savings to keep spending at current levels because inflation is eating into their buying power.
When we take a look at contributions to GDP, we see that consumer spending on housing, health care, and insurance made up 1.16% of the 1.25% growth! In other words, 93% of the growth in GDP in the first quarter was driven by non-discretionary consumer spending! To offset that, spending on non-discretionary goods and services declined - new cars and car parts, recreational goods, and eating out. Clearly the U.S. economy is slowing because the main driver, the consumer, is running out of money. This is clear when you look at the savings rate, total debt (which I looked at last week), and the rising level of delinquent credit cards and auto loans. Watch for the government to step in and pick up the slack in the upcoming quarters heading into the election.
Final Thoughts...
Over the past several weeks, I have received several suggestions that I start a podcast. While that sounds like fun, it also sounds like a lot of work! And writing this weekly update is already more work that I realized when I started. However, I am going to send out a very brief survey early next week to all my current subscribers to gauge their thoughts. You can access the survey here, but I will be sending it out as a separate e-mail. Thanks in advance for your participation. I look forward to getting your feedback.


