Weekly Economic Update 06-07-24: ISM Manufacturing and Services Surveys; Job Openings & Layoffs; Factory Orders; Productivity; and Employment
The views and opinions expressed in this post are solely those of the author and do not necessarily reflect the views of the Georgia Institute of Technology or the Georgia Board of Regents.
300! This week I hit 300 subscribers to the blog! Thanks to all of you who have subscribed and who share it every week! I would love to have 500 by the time I get to the one-year anniversary in August. More about that in the coming weeks.
Also, thanks to those of you who took the time to respond to the brief survey I sent out...especially those who took the time to write something on question #4. There were some encouraging comments, fantastic suggestions, and all criticism was kept to the "constructive" type and it certainly has given me a lot to consider. Thanks again!
One very helpful comment was to provide links to the data sources so you could dig a little deeper and see the original data for yourself. Great idea! It will take me a little longer each week, and I may end up just building a separate page on the Substack site with links to all the data. But one way or another, I'll incorporate that for those who want to dig deeper starting this week!
ISM Manufacturing PMI
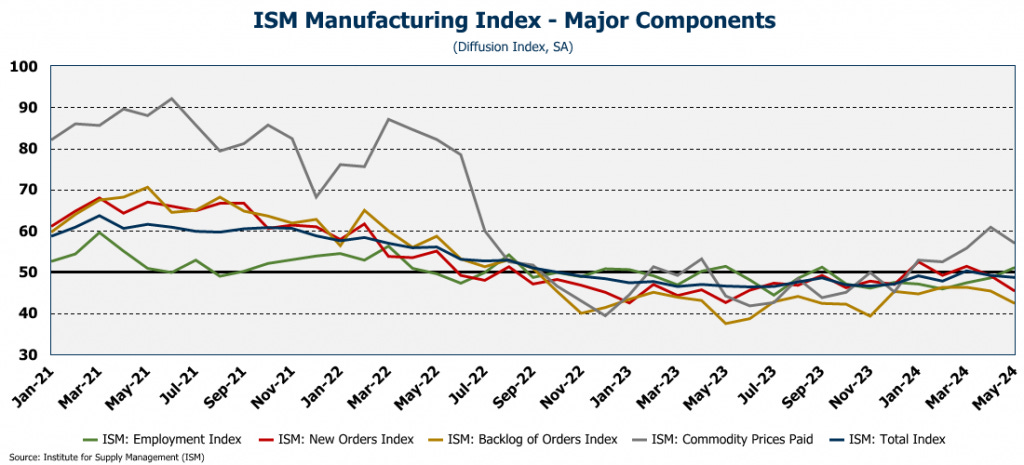
The Institute for Supply Chain Management Purchasing Managers Index (PMI) fell for the second month in a row in May to 48.7, despite expectations for a slight increase (full release here). The index has now been below 50 for 18 of that past 19 months. (A reading below 50 means that the sector is contracting, i.e., in recession.)
Orders for new goods declined to their lowest level since May 2023. The prices paid index fell slightly, but is still much higher than it was all of last year. Higher prices paid for raw materials such as oil, plastics, copper, aluminum are going to put upward pressure on consumer prices keeping inflation elevated. If there was a positive to the report it was that the employment index rose above 50 for the first time since September! In the survey, manufacturers expressed "confidence in the future as a factor contributing to increases in employment." Hopefully they are seeing something the rest of us aren't.
Factory Orders
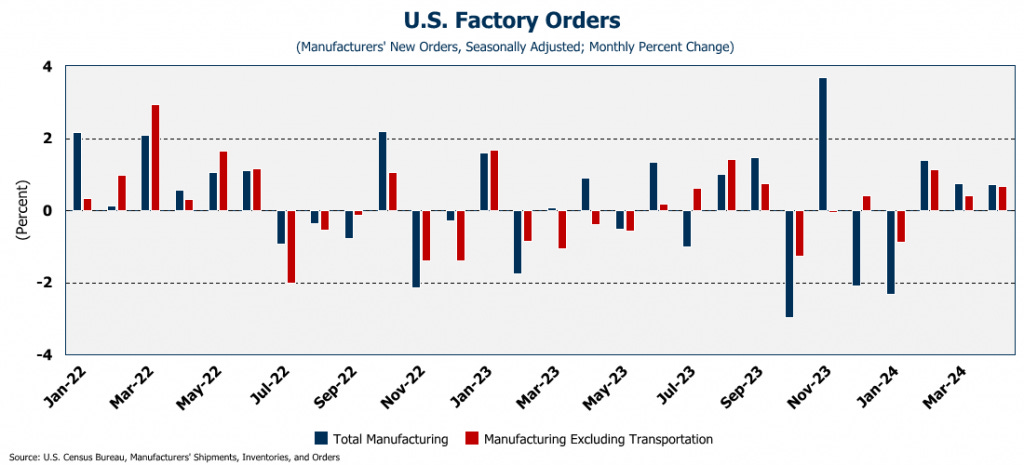
This is why it is always interesting getting data on similar aspects of the economy from two different sources. Take a look above at the ISM index for new orders in April. You will notice that they were down significantly from March, and, as noted above, they fell even more in May. However, this week, the Census Bureau released their data on factory orders in March, and guess what....they ROSE 0.7% (full release here). In fact, it was the third consecutive monthly increase. And orders less transportation rose at just about the same pace.
Obviously, the ISM index is not going to be perfectly correlated with total factory orders, but you might expect that they move in a similar direction! Given the total collapse of the ISM new orders index in May, it will interesting to seen what the Census Bureau says next month.
ISM Services PMI
On a more positive note, the ISM Services Purchasing Managers Index in May jumped from contraction territory in April to 53.8 in May (full release here). That is the highest reading since August 2023 and was much better than Wall Street expected.
Unlike new orders for manufacturing, ISM Service New Orders improved to 54.1. That makes the spread between the two New Orders indices 8.7 points, the widest since last October. And there was more good news...the prices paid index dropped and the employment index rose...both encouraging signs for the service sector. In fact, with respect to employment, survey respondents said that they were having trouble backfilling positions! However, respondents also expressed concerns about 1) high labor costs, 2) the upcoming election, and 3) the slowing economy. That last one is the kicker.....given that services represent such a large share of consumer spending, will the consumer be able to keep this rally in the service sector going?
Job Openings, Layoffs, & Turnover (JOLTS)
According to the Bureau Labor Statistics (BLS) job openings dropped by 296K in April, which followed a revised March decline of 458K (full release here). Job openings came in at 8.06 million, significantly less than the 8.35 million that were expected. That is the lowest number of job openings since February 2021.
Health care an social assistance saw a large drop as openings decreased by 204K. State and local government education dropped 59K openings, but they were offset by an INCREASE of 50K openings in private educational services. (Interesting dynamic between public and private education...that will be something to watch as the summer progresses.)
I mentioned last month that the largest decline in March was in construction which dropped 186K jobs. Those numbers were revised (of course) and the drop was cut to only 110K. Construction openings fell another 8K in April. Combined, the drop in construction job openings in construction over the last two months is be biggest on record.
The gap between the number of job openings and the number of people who are unemployed continues to close and is now at 1.6 million. That is a far different situation than we had in 2022 when there were more than 2 job openings for every unemployed person. The job market appears to be getting much tighter.
Employment
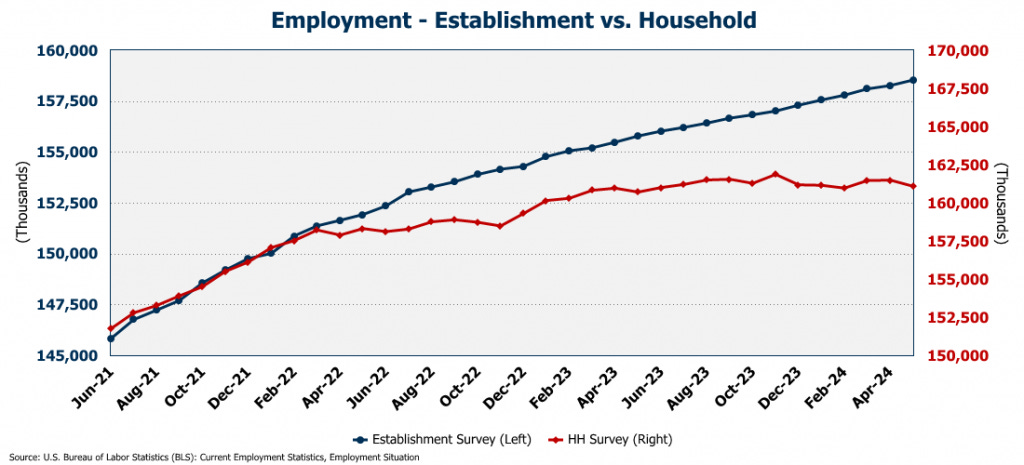
OR, maybe not! Despite the job openings numbers we got on Tuesday, today, the BLS told us that the economy added 272K jobs in May (full release here)! Wow! Expectations were for only 185K! Not surprisingly, the previous two months were revised down 15K. Not huge revisions compared to the recent averages, but still revised down all the same.
However, the unemployment rate ROSE to 4.0%. Why? Because while the payroll survey added 272K jobs, the household survey showed a loss of 408K jobs!! Once again, the two surveys are describing two very different labor markets.
Not only that, but digging deeper into the household survey, we see that once again, job growth was in part-time jobs (+286K), while full-time jobs fell (-625K)! Let me say that again....households reported a LOSS of 625K full-time jobs in May! You're not likely to hear that on the news today. According to the household survey, over the past 12 months, the economy has added 1.5 million part-time jobs, and lost 1.2 million full-time jobs! Even so, the focus on the headline payroll number means that a Fed rate cut in the near term is off the table. (Regular readers know that I think there will be no rate cuts this year.) My guess.....this payroll number will be revised down significantly in the coming months.
Another interesting trend in the difference between native born and foreign born employed workers. In May, the number of native-born employed workers fell 663K, while the number of foreign born employed workers grew 414K! Since the beginning of COVID, the number of native born employed workers is up 100K, while the number of foreign-born employed workers is up 3.2 million! It is clear that employment growth in the U.S. is being completely driven by foreign-born workers.
Productivity (1Q Final)
The BLS released the revised, final reading for worker productivity in 1st quarter, and it was revised down to only 0.2% on an annual basis (full release here). The average for all four quarters last year was 2.8% - 3.8% if you look at only the last three quarters.
It is important to note that productivity data does tend to be quite volatile. However, if the slowdown in productivity continues for several quarters, that would be yet another obstacle in the Fed's fight against inflation. Why? Because if workers aren't being more productive, increasing output requires higher labor costs. Given the adoption of AI we would expect worker productivity not to slow, but to grow significantly. However, high interest rates are restricting company investments in this new technology.
Final Thoughts
In one of the longer survey responses, a reader mentioned that I "rail against the govt and media in a way that comes off as more partisan than academic." I do rail against both the government and media. For the most part, I hold them both in contempt because neither do the job they were designed to do. I was glad to hear that I don't come off as "academic." That would defeat the whole purpose of this update which is to make the economic data easy to understand for the average non-economist!
However, at the same time, I certainly don't mean to come off as partisan. I do try to call balls and strikes. Certainly those who have heard me speak over the past several years will attest to the fact that I have been highly critical of the BOTH the Trump and Biden administrations for spending WAY TOO much money and contributing to the current inflation problem. I know in this blog I have been highly critical of the Republican-led congress and have taken several shots at partisan economists like Paul Krugman.
During one of the last academic graduate classes I taught at Georgia Tech (Public Finance in 2020), a student asked me what I thought about the Trump tax cuts. I asked him what HE thought I thought of the tax cuts. His response was "I have no idea! I have been sitting in this class for 8 weeks and I have no idea where you stand politically!" I replied, "Good! Then I am doing my job well. My job is to give you the facts, not tell you what to think about them, or to color my lecture with my political opinions."
I may not always achieve that standard here, (after all, this isn't a college class) but I'll do my best to be honest and call it like I see it.


