Weekly Economic Update 06-28-24: Building Permits; Housing Starts; New Home Sales; Existing Home Sales; Case-Shiller Home Prices; Consumer Confidence; PCE Inflation; and Personal Income and Spending
The views and opinions expressed in this post are solely those of the author and do not necessarily reflect the views of the Georgia Institute of Technology or the Georgia Board of Regents.
There was a lot of data released this week - and some from late last week that I didn't get to - so today's update may be a little long. But before I get to the data, I want to send out a "thank you" for all the positive feedback from the last two weeks, and especially the response to Monday's post about sharing the update. I added a lot of new subscribers this week. You can find the "Leaderboard" for referrals here. I would assume you have to actually register with a Substack account because right now "Anonymous Reader" is in second place. (Actually, 6 of the top 8 places are an "Anonymous Reader.") In any event, I hope all of you new subscribers will find this weekly economic summary useful.
Now let's get right to it.
Building Permits
Most of the data this week is all about housing, so let's start with where the process begins....building permits. In total, building permits dropped for the third month in a row, falling 3.8% in May. Single-family permits dropped 2.9% down to a seasonally adjusted annual rate (SAAR) of 949K. Multi-family permits also tanked falling 5.6% to a SAAR of only 437K, their lowest level since April 2020 when everything stopped due to COVID.
Looking at the detail, permits for every category of multi-family housing fell, including the 2-4 unit category which posted a rebound in April.
Housing Starts
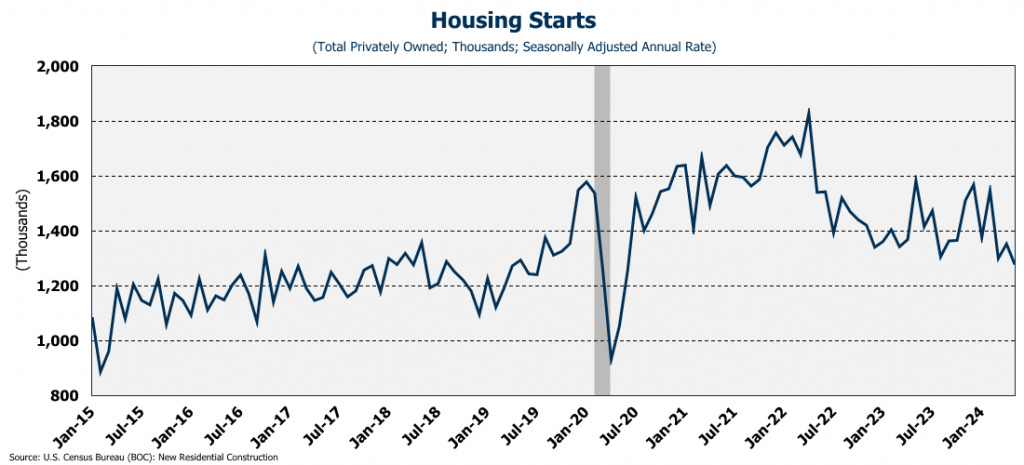
Permits, of course, are very forward looking and tell us what is coming on the horizon with respect to housing supply, as well as demand for all the services that housing requires. Of course, after the permits are issued, come the housing starts. Like permits, they also dropped significantly in May, falling 5.5% from April to an annual rate of 1.277 million units. (And, housing starts in April were revised down quite a bit which makes the May drop even worse.) This is the lowest level of starts since June 2020, again, when we stopped everything for COVID (full release here).
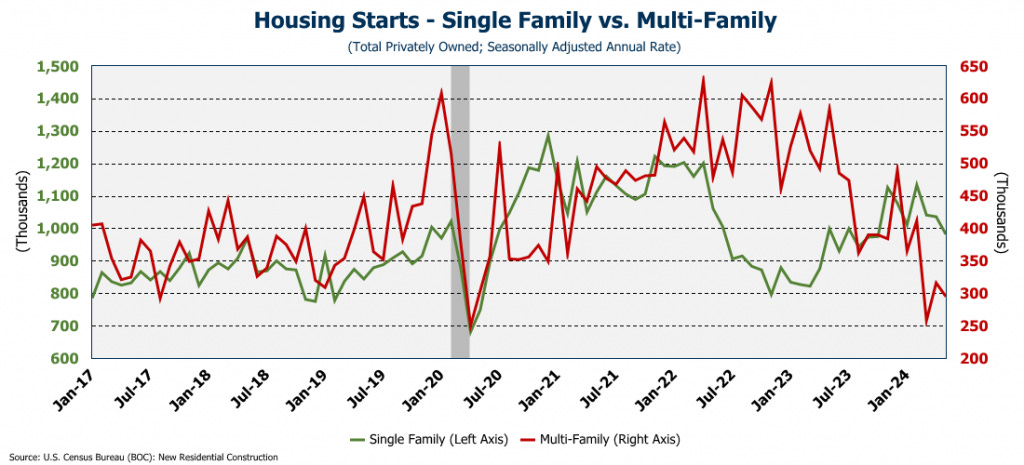
Similar to permits, the fall was across the board as single-family starts fell to a SAAR of 982K, down 5.2%. This was the first sub-million unit rate since October 2023. Multi-family starts also fell 6.6% in the month to only 295K units.
The point here is simple. With rate cut expectations finally aligning with reality, (i.e., there won't be any) there is simply no indication of any sort of recovery coming in the home building sector. But yet, every month, we are told by the Bureau of Labor Statistics that jobs are plentiful, especially in residential construction. But that doesn't line up with the amount of output. Either residential construction workers have gotten much less productive, or we're being lied to about the employment data. I'll let you decide which it is.
New Home Sales
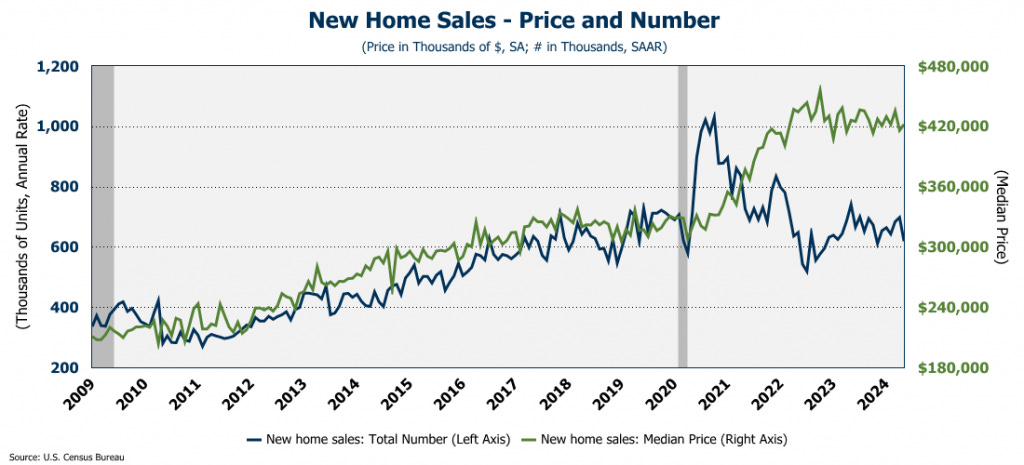
And then, after they are permitted, started, and completed, they are sold. And, like permits, starts, and completions, new home sales plunged 11.3% in May to 619K units (SAAR). That is 16.5% less than one year ago, and was quite contrary to expectations as Wall Street was forecasting an increase in the month to 640K units. Even with the decline, on a seasonally adjusted basis, the median price of a new home rose slightly to $421,961. That is lower than the peak of $455K set in 2022, but it is still moving generally sideways and bouncing around the $420K level (full release here). Only 19% of the new homes sold are below $300K. The AVERAGE price is $520K!
Higher rates are clearly impacting sales, and as mentioned above, builders are slowing production. In fact, in May, the number of new completed homes on the market rose again to 99K. That is the highest number since late 2009! Builders are producing the homes, but they are simply unaffordable. As such, with new home inventory rising so quickly, builders have no reason to bring even more to the market which is why we see permits and starts slowing, as discussed above.
Existing Home Sales
With new home sales slowing, you might think that maybe existing home sales would be picking up the slack. However, as with permits, starts, and new home sales, the realization that rates aren't moving is impacting the sales of existing homes as well. Existing home sales fell for the third consecutive month to an annual rate of 4.11 million. That is 2.8% below one year ago. In fact, on a year-over-year basis, sales have increased since July of 2021. However, even with weak sales, the prices just keep on going up! The median, seasonally adjusted price of an existing home set a new record in May at $405,673. (Not seasonally adjusted the median price was $419,300.) (Full release here)
Curiously, the Chief Economist for the National Association of Realtors (NAR) said, "Eventually, more inventory will help boost home sales and tame home prices gains in the upcoming months." What inventory? New homes? Clearly not as we already have plenty of inventory. I guess the key word here is "eventually." It kind of reminds me of John Maynard Keynes' 1923 book A Tract on Money Reform where he said "in the long run, we're all dead." Yes, I guess "eventually" home prices will moderate. But for first-time home buyers, "eventually" doesn't really offer much hope. In fact, according to the University of Michigan, first-time homebuyer confidence is at an all-time low. Yes, existing home inventory is rising slowly, but at 3.6 months, it is still well below pre-COVID levels. People are either going to have to wait for rates to fall, or come to grips with the fact that 10+ years of free money was not "normal" and we are back to actually pricing in some risk in the financial markets.
Case-Shiller Home Prices
And the final piece of news on the real estate front is the ever popular Case-Shiller Home Price Index. While it does lag a bit, it serves as a confirmation indicator of home prices. According to the index, in April, homes were 7.2% more expensive than one year ago, clearly outpacing overall inflation (as measured by the various government indices). (Full release here) Both the national index and the 20-city composite posted record highs in April.
However, it is important to note that the 7.2% annual price increase was actually DOWN from the 7.5% annual growth posted in March. That is the first decline in annual price growth since last June. Is it possible that with the high inventory and high rates, prices may actually moderate as suggested by the NAR Chief Economist? That is hard to imagine right now, but perhaps we may see a slowing of price appreciation. At this point, just about any slowing of price growth would be welcome news.
Consumer Confidence
With all this news about the struggles in the housing market, it is of little surprise that consumer confidence fell slightly in June as consumers continue to express concern about high prices (full release here). However, they feel slightly better about the present situation as a booming stock market is providing them will a "wealth effect" when they look at their 401k statement, even if it is only on paper. However, confidence in the future (i.e., "expectations") dropped as consumers, concerned with high interest rates, are hesitant to buy a home or a car. (I am starting to see a trend in this week's data....)
PCE Inflation
This morning we got the May report on the Fed's favorite inflation measure, Personal Consumption Expenditures (PCE) (Full release here). On a month-over-month basis the total index was unchanged as a decline in durable goods prices was offset with increases in the cost of services. On a year-over-year basis, the total index declined slightly to 2.5%, and core-PCE (PCE less food and energy) also dropped slightly to 2.6%. But the PCE for services remains stubbornly high at 3.9% and has been moving roughly flat since last December. In short, the report was a mixed bag, but there is little evidence to support a rate cut in the near future.
Personal Income and Spending
Finally this week, we got personal income and spending for May (full release here). Total income was up 0.5% for the month, and disposable personal income was up just slightly less. On a year-over-year basis, however, REAL disposable personal income (i.e., adjusted for inflation) is up only 1.0%. Personal consumption was up 0.2% for the month. But again, on an inflation-adjusted basis, year-over-year, personal consumption was up 2.4%....significantly higher than disposable income. How does real consumption grow faster than real disposable income? Lower savings and more debt.
Final Thoughts
"Resolved: That these United Colonies are, and of right ought to be, free and independent States, that they are absolved from all allegiance to the British Crown, and that all political connection between them and the State of Great Britain is, and ought to be, totally dissolved."
Next Thursday is Independence Day. When writing to his wife Abigail about what the Continental Congress had done, John Adams wrote that the day "will be the most memorable Epocha, in the History of America.—I am apt to believe that it will be celebrated, by succeeding Generations, as the great anniversary Festival. It ought to be commemorated, as the Day of Deliverance by solemn Acts of Devotion to God Almighty. It ought to be solemnized with Pomp and Parade, with Shews, Games, Sports, Guns, Bells, Bonfires and Illuminations from one End of this Continent to the other from this Time forward forever more."
So, as John Adams believed we would, celebrate with your friends and family. Enjoy the "pomp and parade" and the "games, sports, guns, bells, bonfires, and illuminations." But also, don't forget "solemn Acts of Devotion to God Almighty." For it is He who provided, and sustains, our independence and our freedom. Without Him, we are lost.


