Weekly Economic Update 07-12-24: Consumer Price Index; Producer Price Index; and Consumer Credit
The views and opinions expressed in this post are solely those of the author and do not necessarily reflect the views of the Georgia Institute of Technology or the Georgia Board of Regents.
There I was. On the beach enjoying a wonderful vacation with family and friends. Not a cloud in the beautiful blue sky. The sun was shining causing the surf to twinkle with a million stars of sunlight. I was celebrating my birthday, and giving not a single thought to putting out an update this week.
And then they released the consumer price index.
Suddenly, the economic world turned upside down. All over X (formerly known as Twitter), LinkedIn, and my various news feeds, everyone is saying that we will have not one...not two...but THREE rate cuts this year! Mortgages will suddenly be affordable! Inflation has been beaten! Everything is coming up sunshine and roses! We are saved!
I couldn't take it anymore. So, here is a VERY brief update, being hammered out while the waves crash all around me. (I am speaking literally there...not metaphorically....although....)
Consumer Price Index
On a month-over-month basis, the consumer price index (CPI) did fall 0.1% (full release here). That is the first month-over-month decline since May 2020. However, on an annual basis, it is running at 3.0%. Core CPI (less food and energy) is running at 3.3%. (By the way...Core CPI did NOT decline month-over-month).
However, that "Super Core" CPI is still running at 4.9%! Why is that? And why did CPI actually fall month-over-month?
One word - shelter. Shelter is 36.2% of the CPI basket. More importantly, "owners equivalent rent" (OER) of their residence is 26.7% of the CPI basket. What is OER? Well, basically, the BLS asks people "if someone were to rent your home today, how much do you think it would rent for monthly, unfurnished and without utilities?" They aren't trying to track the change in the cost of home, but the value of their shelter consumption, which is the amount they would have spent to consume the same amount of housing services provided by their owner-occupied home.
And it lags significantly because people who are not actively in the rental market are not experiencing the actual fluctuations in shelter costs. Rents peaked in August 2022. On a year-over-year basis, they were actually FALLING by June of 2023. So, when rents were actually falling 12 months ago, it wasn't getting picked up in the CPI numbers. Now it is. And in June, OER posted the third largest one month decline since 2009. And THAT is why the June CPI number showed a month-over-month decline. And frankly, why it may continue as the lag in OER catches up.
Of course, "Super Core" excludes shelter! And this is EXACTLY why it does! The data lags and doesn't really tell us what the consumer is actually experiencing. And once you get rid of shelter, food, and energy (the latter two of which are very volatile) the consumer is facing 5% inflation.
So the important point here is that nothing has really fundamentally changed! And, in fact, rents are starting to edge back up! Over the past two weeks, the economic data from the private sector has been quite concerning. The private sector economy is clearly showing signs of a significant slowdown. And now certain Fed officials (and people on Wall Street) want to use that, coupled with this "dovish" CPI reading, to justify rate cuts.
Such a move would be a terrible mistake. Yes, the economy is slowing. But inflation is still running high...significantly higher than the Fed target. Cutting rates now would only increase inflation, and may not have the stimulating effect people expect on the private economy. That would leave us with slowing economic growth AND high inflation. We've seen that movie before. It is called stagflation.
Producer Price Index
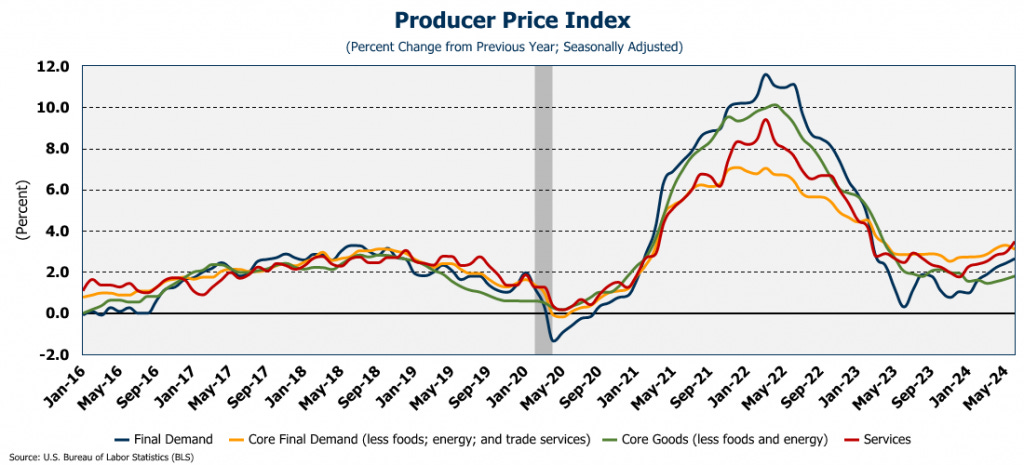
To prove my point, the producer price index (PPI) came out this morning, and it was MUCH hotter than expected (full release here). And PPI leads CPI. The overall PPI rose 2.6%. It was expected to only rise 2.3%. That was the largest monthly advance since early 2023. The last three months have been 2.2%, 2.4%, and now 2.6%. That is moving in the wrong direction.
And again, the story is in services which grew annually at 3.8% in June. The last three months for service PPI have been 3.4%, 3.6%, and now 3.8%. The story is clear. Despite all the false narratives surrounding the CPI release this week, the data clearly show that inflation is NOT under control. The Fed should NOT even consider lowering rates. And they know it.
Consumer Credit
Since I am writing an update, I might as well provide a quick comment on the consumer credit data that came out on Monday. You may recall that in April, we finally saw a decline in revolving debt and thought, perhaps, the consumer has finally had enough.
Apparently not.
There seems to be no bounds to the spending-addicted U.S. consumer. Total consumer credit rose $11.3 billion in May, much higher than the $8 billion that Wall Street was expecting. That represented a 2.7% annual rate of growth. Revolving credit (e.g., credit cards) grew $7 billion which represented an annual rate of 6.7%. And this is with the average rate on a credit card rising to 22.76%!
And Millennials now hold a record 42.4% of that consumer credit.
Final Thoughts
Again, sorry for the short update. But I wanted to comment on the CPI data. Now, back to the beach.


