
Weekly Economic Update 07-26-24: New & Existing Home Sales; Durable Goods; Personal Income & Spending; PCE Inflation; and 2nd Quarter GDP
Sponsored by: Your company name here!
The views and opinions expressed in this post are solely those of the author and do not necessarily reflect the views of the Georgia Institute of Technology or the Georgia Board of Regents.
With all that is going on in domestic politics right now, it seems almost bizarre to write about economic data. Any thoughts about the state of the economy have been pushed far down on the list of what people are thinking and/or talking about. And while domestic politics (and more specifically domestic policy) certainly play a role in the economy, I am going to forego the temptation to comment on all the happenings of the past two weeks. I am sure you are getting quite enough of that through social media, cable news, internet blogs, and conversations with family and friends. Instead, I’ll stick to what I know….
Existing Home Sales
…and what I know is that the housing market is a mess! Existing home sales plunged for the fourth month in a row, dropping 5.4% in June to an annual rate of only 3.89 million units. That is getting dangerously close to last years’ bottom of 3.85 million units. If this continues, existing home sales could challenge the all-time low of 3.45 million units we saw after the housing/financial crash in 2007-08. On a year-over-year basis, existing home sales haven’t risen since July 2021. And the decline is virtually across the board. The only homes that saw a sales increase on a year-over-year basis were those priced in excess of $1 million. Sales in that category were up 3.6%. (I guess for people in that price range, the mortgage rate is less of a factor…or perhaps not a factor at all.)

Despite the decline in sales, and the fact that the 30-year mortgage rate continues to hover around 7.0%, the median sales price of existing homes continues to rise, and set an all-time high in June at $426,900! That is 4.1% above last year, even as the number of sales plummet. This is not how a normal housing market typically functions.
New Home Sales
Next, the Census Bureau released data on the sales of NEW homes in June and the story isn’t much better. On a month-over-month basis, new home sales fell 0.6% in June, but that was after a huge downward revision to the number of sales in May. On a year-over-year basis, new home sales came in at an annual rate of 617K units, down 7.4% from a year ago and the lowest since last November.
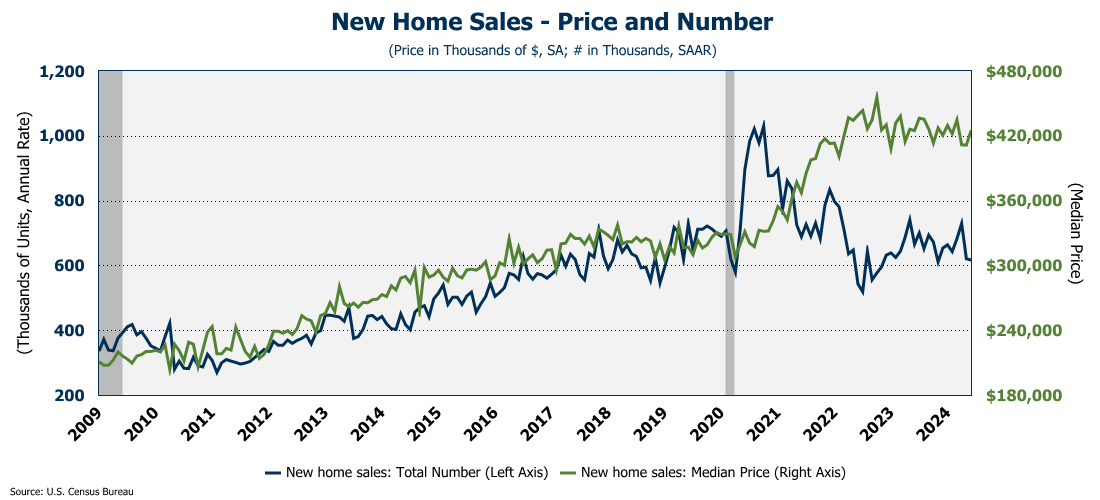
And as was the case with existing homes, despite the decline, prices rose in June. The median sales price of a new home was just over $425K. Prices for new homes have been bouncing around that general level since mid-2022.
With mortgage rates showing no signs of easing, mortgage applications are down to levels not seen since 1995. And even so….prices remain stubbornly high.

It is no wonder that mortgage applications are declining as home buyer confidence is the lowest it has been since the statistic started being tracked in the 1980s.

And that is probably because the Home Affordability Index hasn’t been this low since the late 1980s! The Affordability Index is currently below 100, which means that a family with the median income can’t qualify for the a mortgage on a median priced home.

As a result, builders of new homes are now sitting on nearly 100K completed units that are for sale - the highest level since January 2010. And they have another 274K under construction!

And yet, prices remain elevated. As long as mortgage rates stay this high, affordability isn’t likely to improve. And rates won’t drop until the Fed cuts them. All week long all I have heard on the business news is that the Fed will cut rates next week. Obviously, I don’t think they will. However, with all the recent economic data, I have come to the conclusion that IF the Fed makes the mistake of cutting rates this year, it won’t be because inflation has been beaten. It will be because they are trying to keep the economy from falling into recession.
Durable Goods
To my point, data on durable goods orders was released on Thursday and it was devastating. Durable goods orders fell 6.6% in June…the largest monthly decline since we shut the economy down in early 2020 in response to COVID-19. Wall Street was expecting an INCREASE of 0.3%!

The biggest drag on the data was transportation. If you exclude transportation, new orders were up 0.5%. Defense spending led the way with new orders for defense-related goods up 6.1% in the month. Without defense spending, durable goods orders fell 7.0% in June. Wasn’t there supposed to be a huge wave of cap ex spending related to AI?
Gross Domestic Product (2nd Quarter Advance Estimate)
But never fear! The economy is doing great! Just ask the Bureau of Economic Analysis which gave us the first look this week at how the economy performed in the 2nd quarter. And the economy is strong, growing at a robust 2.8% between April and June! That is DOUBLE the pace of the 1st quarter! And much stronger than the consensus forecast. I guess Bidenomics is working! (It’s too bad he dropped out…)
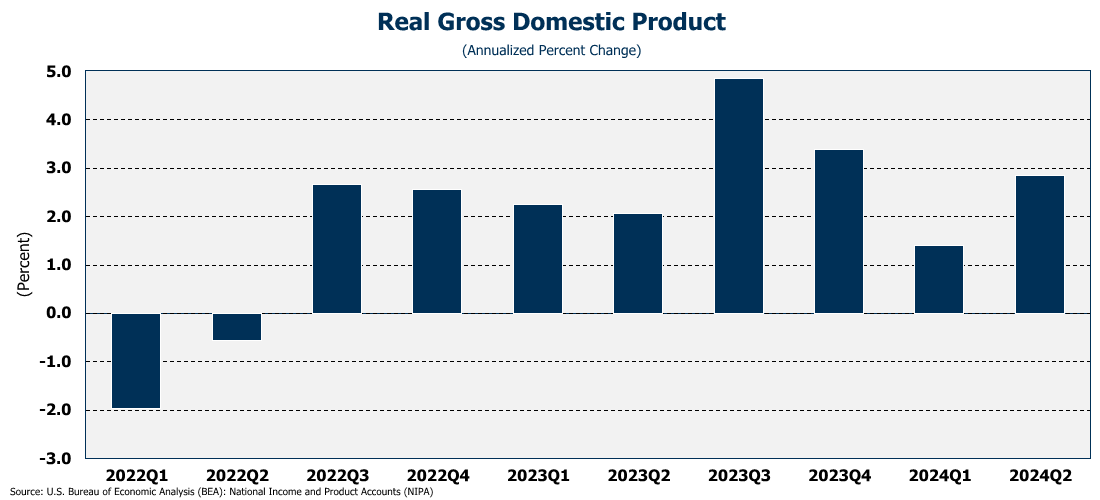
The jump was driven by (drumroll…..) consumer spending! The consumer just keeps on spending and as a result, the economy just keeps on growing. Consumer spending represented 1.6% of the 2.8% growth! Other positive factors included growing inventories as well as non-residential fixed investment.
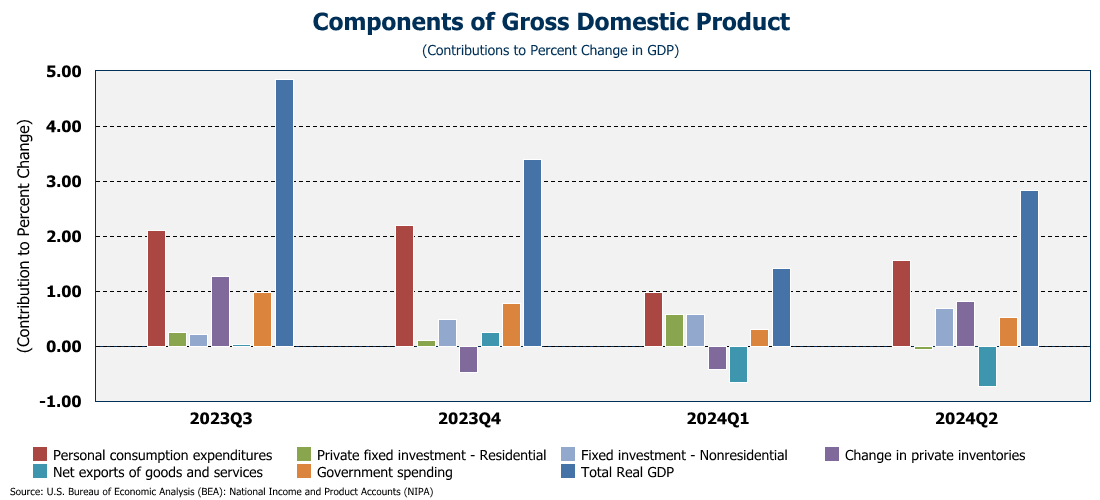
But wait a minute! We just pointed out how weak durable goods orders have been in Q2! I even made a snide comment about the AI cap ex we have been told about. How can non-residential fixed investment be making such a strong contribution to GDP? Digging into the GDP report, we see that investment rose 8.4% quarter-to-quarter, which was the highest since Q3 2023. And, growth in “information processing equipment” rose 10.2% quarter-over-quarter! So apparently there has been AI cap ex spending! Why isn’t it showing up in the durable goods data? Something is amiss.
In any event, this report will crush most suggestions of an impending recession. Which brings back the question, will the Fed cut rates next? I suggested above that if they did, it would be to stave off a recession. But, if a recession is off the table, then the only possible rationale for a rate cut would be because inflation is beaten? Is it? Well, we got the latest read on PCE inflation measure….
PCE Inflation
…and no, inflation has not been beaten. The Fed’s favorite measure of inflation, core PCE, came in hotter than expected rising 2.6% year-over-year. PCE services inflation finally dropped below the 4% level but is still running 3.9% year-over-year. Further, so-called “super core” (PCE services less housing services) has been moving in the wrong direction since the spring and now sits at 3.5%. There is just no evidence on the inflation front to justify the Fed cutting rates next week.

Personal Income & Spending
And finally this morning, we got data on personal income and spending for June. Personal income was up 0.2% for the month, but spending rose 0.3%. (Not surprising given what we saw in the GDP report.)

On a year-over-year basis, spending continues to outpace income, as it has for quite some time. As such, the savings rate fell once again in June to 3.4% as people continue to finance their spending with growing amounts of debt.

And high debt leads to high rates of charge-offs. For small commercial banks, credit card charge-off rates are now at 9.5%…the highest they have been since 2003.

Final Thoughts
My current plan is that, beginning with the October 4 issue, the Weekly Economic Update will move to a paid subscription model. At least initially, there will be a drastically scaled down free version each week that contains SOME of the information. However, paid subscribers will receive the full version, including graphs; the ability to comment on posts and ask questions; and participate in occasional economic discussions. In addition, since 80% of my subscribers are in Georgia, for paid subscribers, I plan to produce a quarterly update specifically for the Georgia economy. To go ahead and subscribe, you can click on the “Pledge Your Support” button below and when I turn paid subscriptions on, you will automatically be enrolled. (You won’t be charged until I activate paid subscriptions.)
A lot of time and effort goes into producing the update each week, and the cost of my data service is in excess of $20K per year. Moving to a paid version will help me offset some of that cost (but frankly won’t come close to covering it). If you find the Weekly Economic Update useful, I ask that you consider getting a paid subscription.
Also, I am still open to having a sponsor! Reach out if that is something you, your company, or your community would be interested in discussing.