Weekly Economic Update 08-16-24: PPI; CPI; Retail Sales; Industrial Production; Building Permits; Housing Starts; Home Builder Confidence; and Mortgage Applications
Sponsored By: LOCI Fiscal Impact Model
The views and opinions expressed in this post are solely those of the author and do not necessarily reflect the views of the Georgia Institute of Technology or the Georgia Board of Regents.
This was a big week for economic data - inflation, retail sales, industrial production, and the housing market were all on tap this week. The data was mixed, and much of it was misrepresented in the main stream business press, but over all the stock market liked it and, despite the political implications, everything seems to be lining up for a September rate cut.
Producer Price Index
Prices at the producer level were expected to slow in July, and that is exactly what happened (full release here). Overall, producer prices grew 0.1% in July, bringing the year-over-year rate down to 2.3%. And frankly, that is what will be reported far and wide to show that inflation is slowing.
However, as usual, the devil is in the details. CORE final demand (removing food, energy, and trade services) rose 0.3% - the highest monthly increase since April. Focusing only on goods, the PPI for final demand goods rose 0.6% in July - the largest advance since January. However, most of that is due to the price of gas rising 2.8% in the month. Removing energy, we see that final demand core goods rose 0.2%, or 2.1% year-over-year. The problem is that the annual growth in PPI for core goods has been steadily moving up since March.
So if goods and core goods are all moving up, then what caused the overall PPI to fall? Services. The PPI for services dropped 0.2% in July, bringing the annual growth rate down to 2.6% from the 3.5% rate posted in June. That is a HUGE drop and it caused the overall PPI to fall as well. But with goods inflation still rising at the producer level, it remains to be seen if this drop in PPI can be sustained.
Consumer Price Index
Well, this is the final CPI reading before early voting starts in the 2024 Presidential election. And if you are an incumbent (or sort of an incumbent?) the numbers were good. For the first time since March of 2021 the headline number dropped below 3.0% coming in at 2.9%. Core CPI also dropped to an annual rate of 3.2% continuing its decline. “Super core” (core services less shelter) also fell to 4.7%. Still far too high, but it moved in the right direction. In total, it looks like this report will give the Fed more reason to cut rates in September - despite the overt politics associated with such a move (full release here).
Here is the problem. Money (as measured by M2) is growing at 4.3% on an annualized basis. An increase in the money supply is the very definition of inflation. At Milton Friedman famously said, “inflation is everywhere and always a monetary phenomenon.” I don’t care how you “measure” inflation - CPI, PPI, PCE, GDP deflator, etc. - at the end of the day, it is all amount growth in the money supply, and that is growing in excess of 4%. Yes, there was a pull-back in M2 from mid-2022 through mid-2023, which corresponds to the drop in CPI. However, M2 is now growing again, and is still well above trend. The threat of a “bounce,” or even a second wave of inflation is very real. But with the economy slowing, the Fed will have to cut rates to stave off a recession, but in doing so, will raise the risk of further inflation.
Retail Sales
Despite rising prices, consumers keep on spending. According to the Census Bureau, retail sales grew 1.0% in July, the largest monthly increase since January 2023 (full release here). This news moved the market in a positive direction on Thursday as everyone on TV was reporting this as an indicator of a strengthening economy. Of course, what they didn’t tell you was that the June number was…you guessed it…revised DOWN. Recall last month when retail sales surprised to the upside and came in flat while they were expected to decline. Well guess what? They were revised down to a decline of 0.2%! And because of that decline, the INITIAL July number has come it stronger than expected. Why is it that nearly all data gets revised down? You would expect normal statistical variance to result in some data being revised up. Doesn’t seem to happen like it should.
Another interesting point in the data is that two-thirds of the increase was due to auto sales, which isn’t too surprising as dealers have recently been dramatically cutting prices! I’m not sure this is actually indicative of a strong economy.
And the final note on retail sales, is that this is reported in nominal terms (i.e., not adjusted for inflation). If we adjust the July data for inflation, we see that once again, REAL retail sales are negative on an annual basis, and have been for 16 of the past 21 months. Wages are not keeping up with inflation and as a result, when you adjust for inflation, people are spending less. Again, not indicative of a strong economy.
Industrial Production
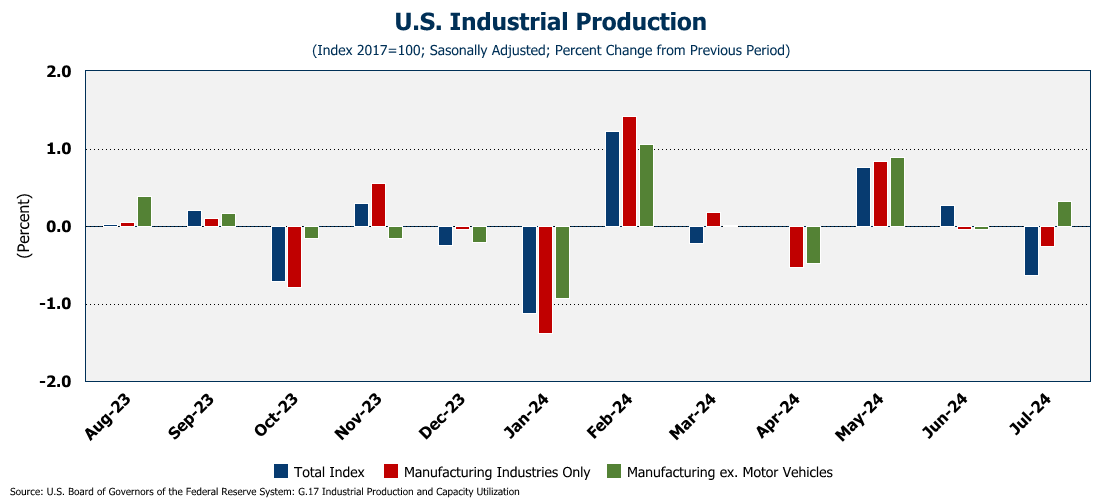
The ISM manufacturing index has been showing a slowdown in activity for months, and now, Federal Reserve data confirms the decline (full release here). Overall, industrial production fell 0.6% in July - the first decline in four months, and much larger than the 0.1% decline that was expected. Manufacturing fell 0.3% in July as the industry continues to struggle with high interest rates. The capacity utilization rate (a measure of the operating limits of the country’s factories, mines, and utilities) dropped to 77.8 in July. In mid-2022 it was over 81%, but has been on a downward trend as domestic manufacturing has struggled.
Home Builder Confidence
Despite the fact that mortgage rates have been improving since May, home builder confidence continues to fall, dropping to an 8-month low of 39.0 in August (full release here). Buyers are simply still on the sidelines waiting for a rate cut from the Federal Reserve. Even with the recent decline in rates, builders are still having to cut prices and offer incentives for people to buy. In August, one-third of builders cut prices, up slightly from 31% in July. The average price cut was 6%. Nearly two-thirds of builders are having to offer other incentives, including mortgage-rate buydowns, to attract buyers.
Digging into the details, however, we see that while “traffic of prospective buyers” is moving down, home builders’ outlook for the next 6 months moved up in August, again, most likely due to expectations of a Fed rate cute next month.
Building Permits
And because home builder confidence is so low, building permits plunged 4.0% in July (full release here). Single-family permits were down slightly and have now fallen for six consecutive months. However, the big driver was multi-family permits which dropped 11.1% in July. In total, building permits are getting down to levels we haven’t seen since we shut down the whole economy for COVID.
Housing Starts
Not surprisingly, we are seeing the same thing with housing starts - if you aren’t issuing permits, you aren’t starting construction.
Housing starts dropped another 6.8% in July, far beyond the 1.5% drop that was expected. On a year-over-year basis, housing starts are down 16% from July 2023. But even that was due to multi-family starts improving slightly. Single-family starts were down 14.1% in July. Again, the market is waiting for rates to drop with the hopes that lower rates will spark buyers/sellers to re-engage in the market.
But what I still can’t figure out is that with such a decline in residential construction activity, the level of employment in residential construction continues to grow. I think I need someone from the Bureau of Labor Statistics to explain that one to me. Frankly, it makes me further question the employment data we are getting each month.
Mortgage Applications
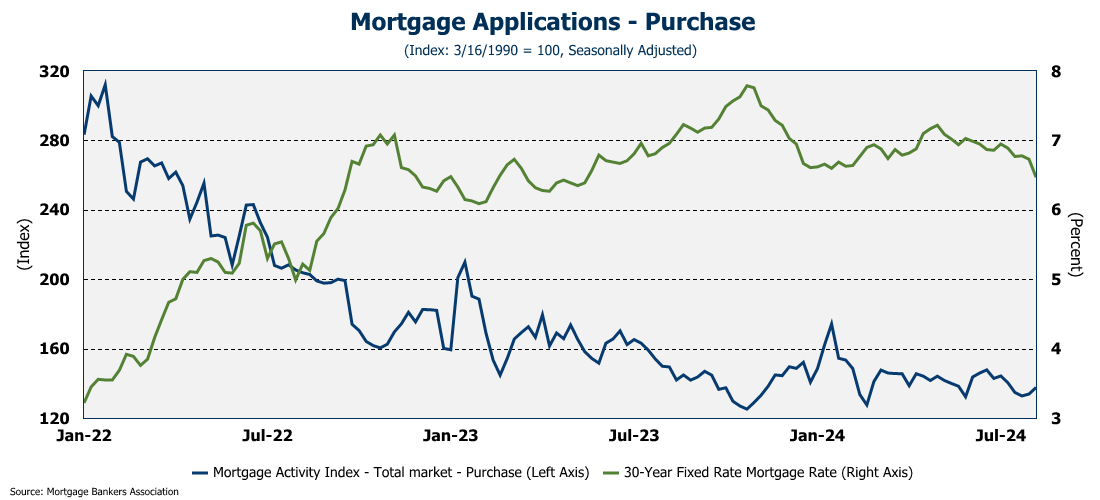
Finally, with the anticipation of a Fed rate cut in September, the bond market is already adjusting, which in turn, is impacting mortgage rates. For the most recent week, the 30-year rate dropped to 6.47% - 26 basis point below the previous week and more than 130 basis points below the peak of last fall. This produced a very small uptick in applications for using purchasing a new home.
However, it triggered a huge jump in applications for mortgage refinancing! Which is interesting because the average rate on all mortgage debt outstanding is only 4.0%. The index tracking applications for mortgage refinancing had the biggest weekly move since March 2020 and it is up 55% in two weeks! The level of activity is still not great, but if you are in the mortgage lending business, it has to have felt like you were in the great depression recently. Any indication of an uptick in business has got to be welcome news.
Final Thoughts
Each week I never know what is going to connect with my readers. Last' week’s economic update was apparently a hit as it set a record for one-day views and reader shares. In addition to a lot of reader sharing, several of you showed your support by “buying me a coffee." (or in some cases, more than 1!) Shout outs and “thank you” to Mark Tumbleston, Randy Muecke, Tommy Jennings, Chris Braun, and Julian Arias for their support of my weekly efforts. If you would like to help out and support this effort, please click the image below.
Also, I am still open to a long-term sponsor - maybe a bank, a broker, a financial advisor? If I get that, I can keep the entire update free for everyone! Until then, I’ll just post an ad for my fiscal impact software…since I am essentially sponsoring this myself.
The Weekly Economic Update is sponsored by:


