
Weekly Economic Update 08-22-25: Home Builder Confidence; Housing Permits & Starts; Existing Home Sales; and Industrial Production
The housing market is really starting to get interesting.
The views and opinions expressed in this post are solely those of the author and do not necessarily reflect the views of the Georgia Institute of Technology or the Georgia Board of Regents.
Two years. This week marks exactly two years since I started writing this weekly Substack. Two years ago, my first post got 10 views. One year ago, my first anniversary post got just over 1,000 views. Last week’s post set an all-time record of 3,000 views…one thousand more than the previous record. Thanks to everyone who has subscribed, shared, “re-stacked,” and a special thanks to those who financially support this effort.
Every once in a while, the calendar falls in such a way that we get nearly all the housing-related data in one week. This is one of those weeks. With the exception of new home sales (which come out on Monday), we got just about everything we need to know about the state of the housing market this week.
Let’s face it. Home affordability is a major problem in this country, and mortgage rates, while an issue, aren’t really the primary problem. The 30-year rate approached 6.5% last week. According to Zillow, in my home state of Georgia, the “typical” home price is $338,734. Let’s say somehow, you magically were able to assemble a 20% down payment of nearly $68K, and could get the mortgage down to about $270K. On a $270K mortgage, a move from 7% to 6.5% drops the monthly payment by $90. Now, $90 isn’t nothing, but if $90 is what is keeping you from buying a house…may I suggest that you have no business buying a house.
No, the main problem is quite simple…wages haven’t kept up with inflation, and they certainly haven’t kept up with housing inflation. In 1970, the median home price was 2.5 times the median household income. By 1980, it was 3.2 times, and it stayed roughly at that level for 20 years. But in 2000, it started to rise, and during the housing bubble it peaked at 5 times household income. Ater the bubble burst, it fell back to the 3.5 range, but then it started rising. By 2018, the median home was 4.2 times the median household income. But after COVID, it rose sharply and is now in the 5x range where it was during the housing bubble in 2005.
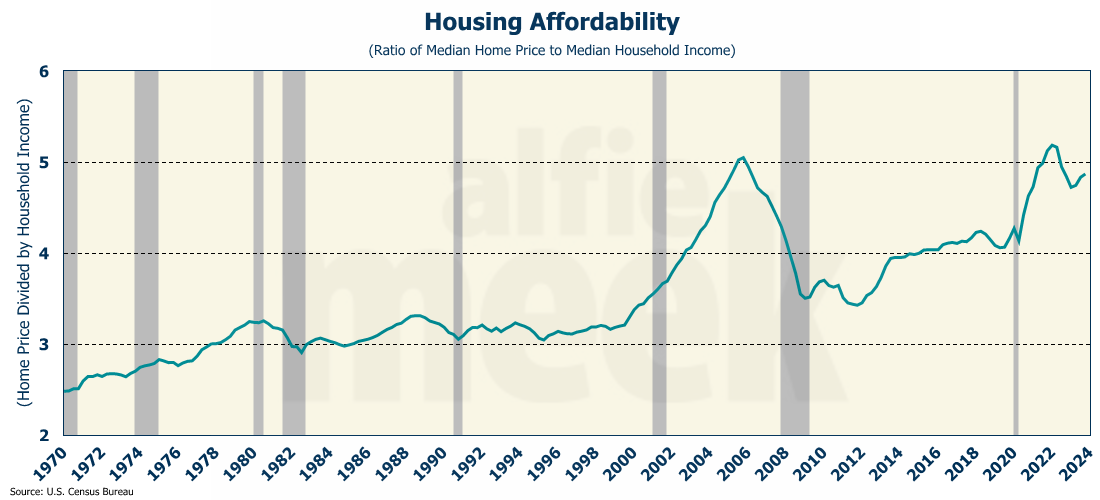
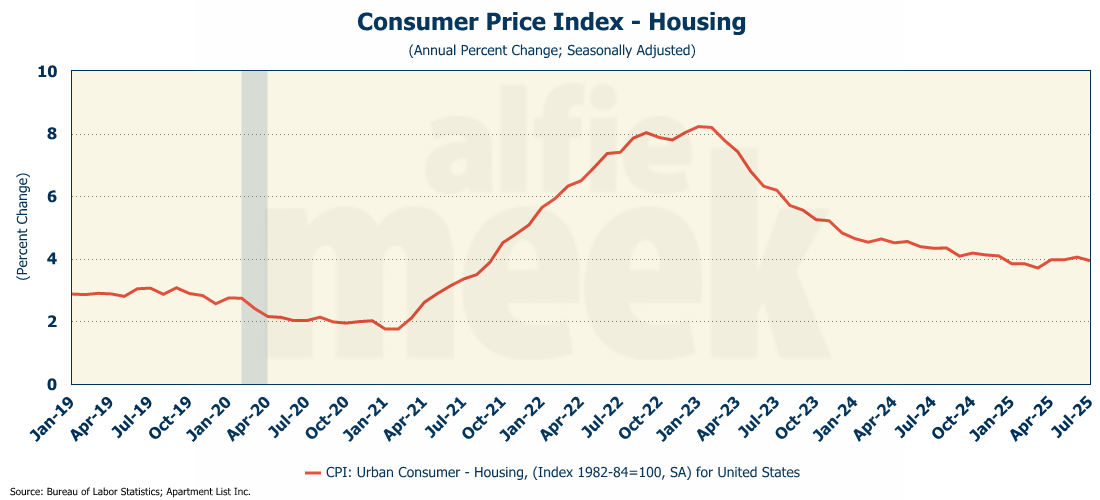
So, is this another bubble? In 2005, you could qualify for a home loan if you had a pulse and knew how to sign your name. That led to artificially high demand which drove up prices. That isn’t happening now. Much of the current price increase is simply due to inflation. In 2005, home prices were skyrocketing, but overall housing inflation was only running about 2.5%. Today, housing inflation is still above 4%, and is coming off a two-year period where it was running over 5% and peaked at 8%.
Prices may pull back, and in some areas, there will be (or currently is) a significant decline. But nothing like we saw in 2007. Inflation is an insidious tax on people, and it hurts. Until wages catch up, home ownership is going to be out of reach for a lot of people, especially Millennials and Gen Z.
There are serious consequences when the government prints money to fund its various schemes. Ronald Regan once said, "We don’t have inflation because the people are living too well, we have inflation because the government is living too well.” As long as the government is living well, the rest of us won’t.
Home Builder Confidence
The National Association of Home Builders (NAHB) Market Index fell in August to 32, which is the second lowest level since the COVID collapse in April 2020 (full release here). This is despite the fact that mortgage rates actually improved during the month. Like I said above, the housing market is being driven by more than just the mortgage rate.
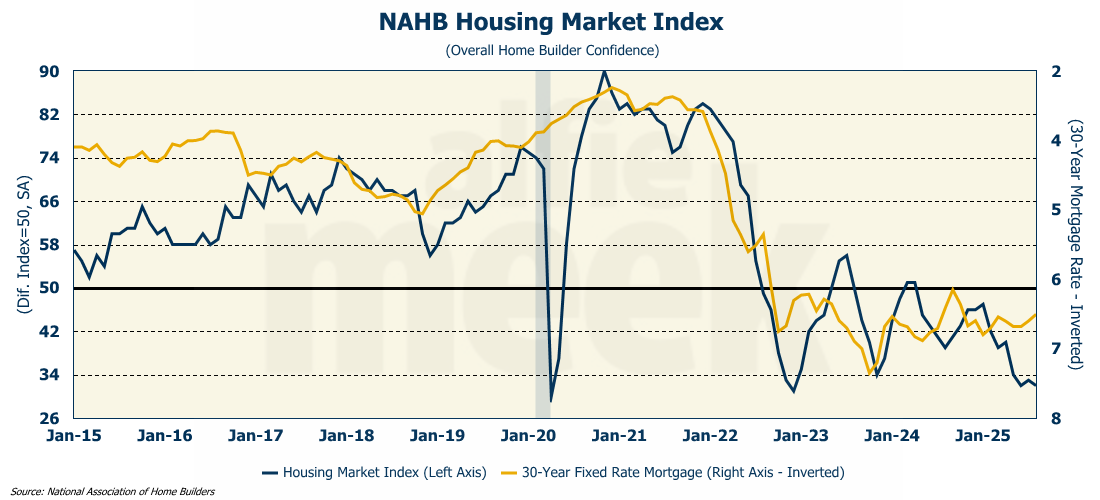
The index has been below 50 for 16 consecutive months. A reading below 50 is an indication that the majority of builders do not feel confident about the current and near-term outlook for housing.
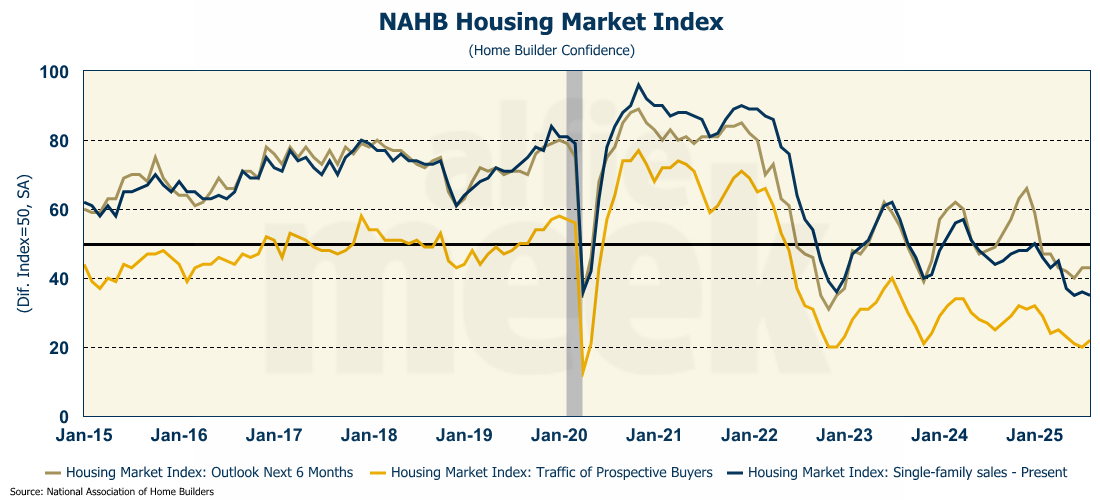
Builders’ outlook for the next 6 months was unchanged at 43. The sub-index for current demand fell slightly, while surprisingly, the sub-index for buyer traffic rose slightly.
In August, 37% of builders cut their prices (down from a recent high of 38%) with the average reduction being 5%. However, the use of other sales incentives grew to 66% - the highest level since May of 2020 when COVID was just hitting us hard.
Housing Permits & Starts
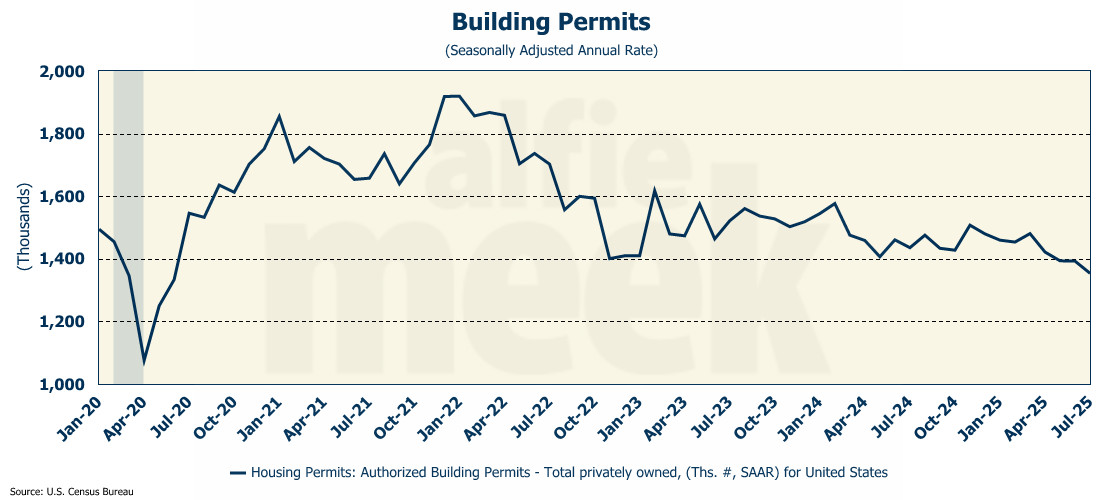
The negative builder sentiment can also be seen in the number of building permits they are pulling. Building permits serve as a forward-looking indicator of the U.S. housing market, and in July, permits fell for the fourth month in a row to an annual rate of 1.354 million units (full release here). That is the lowest level since the COVID crash.
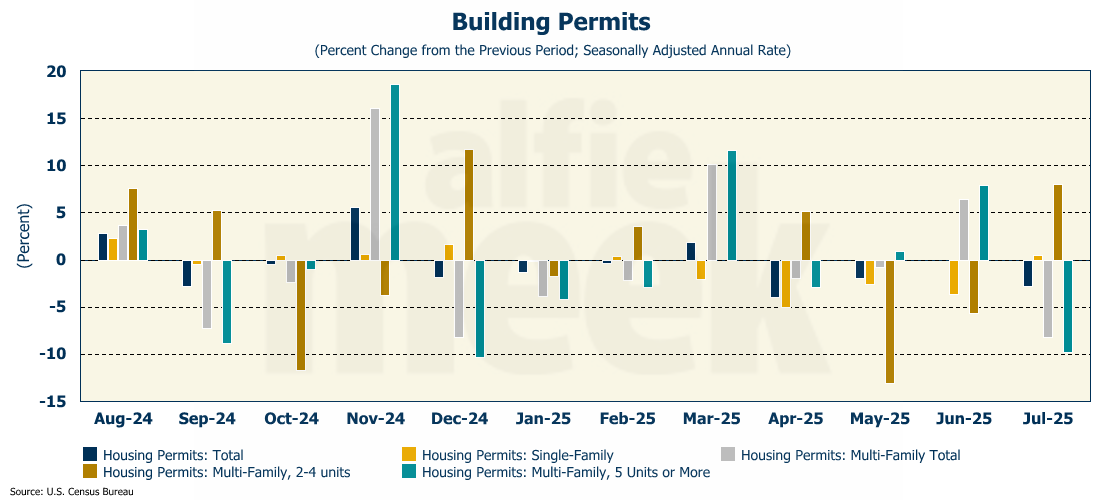
Single-family permits were up very slightly in July (0.5%), but multi-family permits plunged 8.2% which brought down the overall total. And the decline in multi-family was driven by units with 5 or more units which dropped 9.7%.
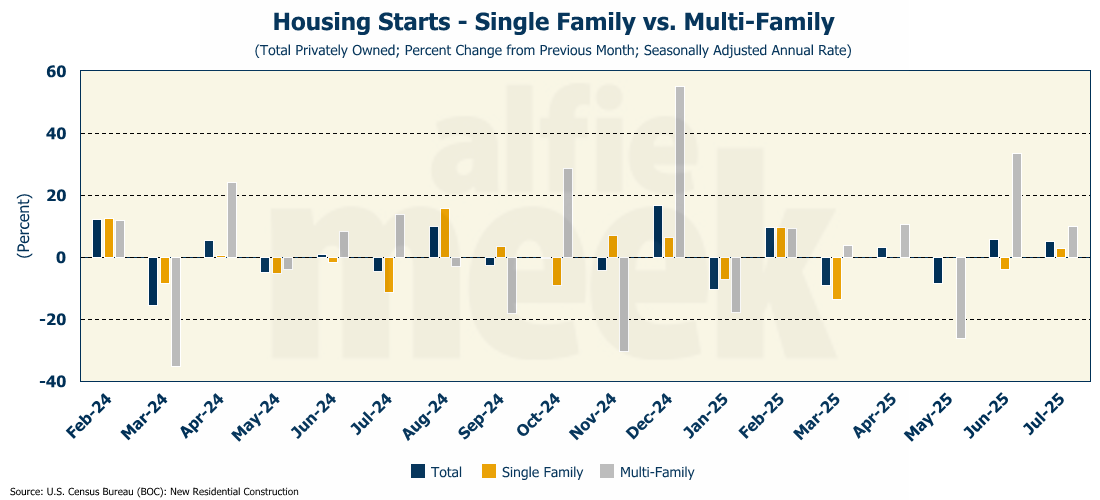
While permits were down, the data for housing starts was mixed. Overall, housing starts were up 5.2% with single-family starts up 2.8% and multi-family starts up 9.9%.
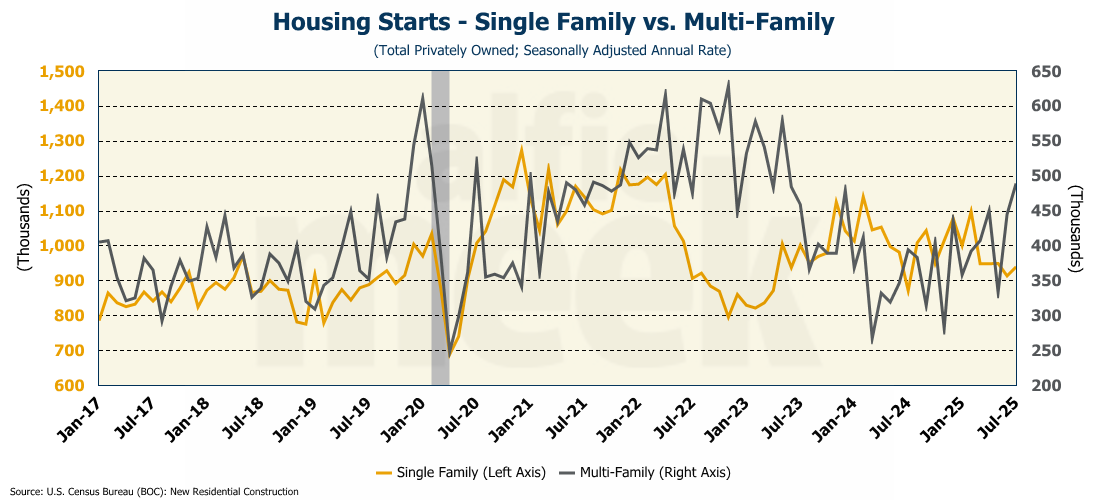
The number of multi-family starts is at the highest since May 2023 coming in at an annual rate of 489K units. Single-family starts, while up in July, are only running at an annual rate of 939K units, less than pre-COVID.
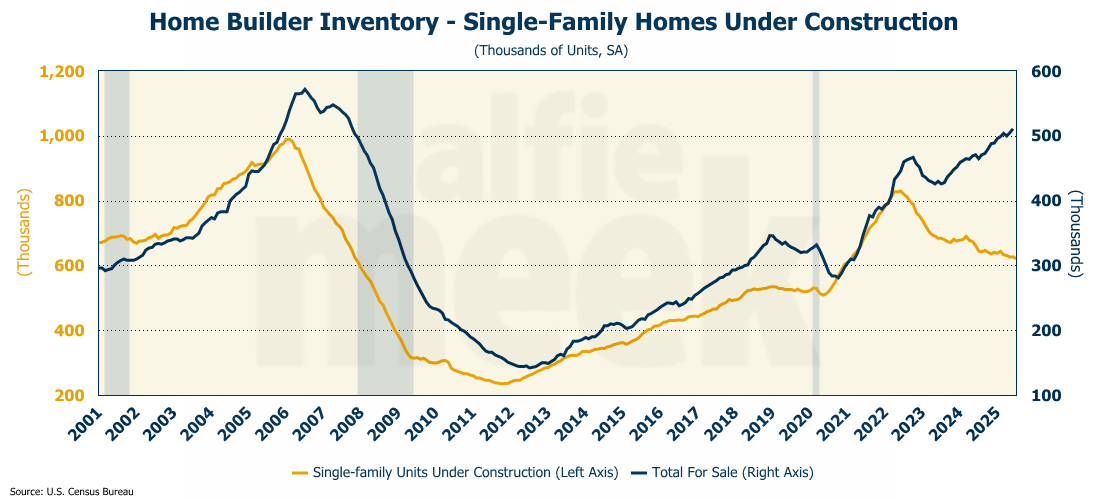
Here’s the problem. The home construction pipeline in this country is slowing. Homes under construction have fallen to a four-year low, while the level of builder inventory is at an 18-year high.
Housing completions have been falling for a year. Clearly builders are slowing production - either because demand is weak and inventory is high; or because everyone who knows how to build a house has been deported or has left voluntarily.
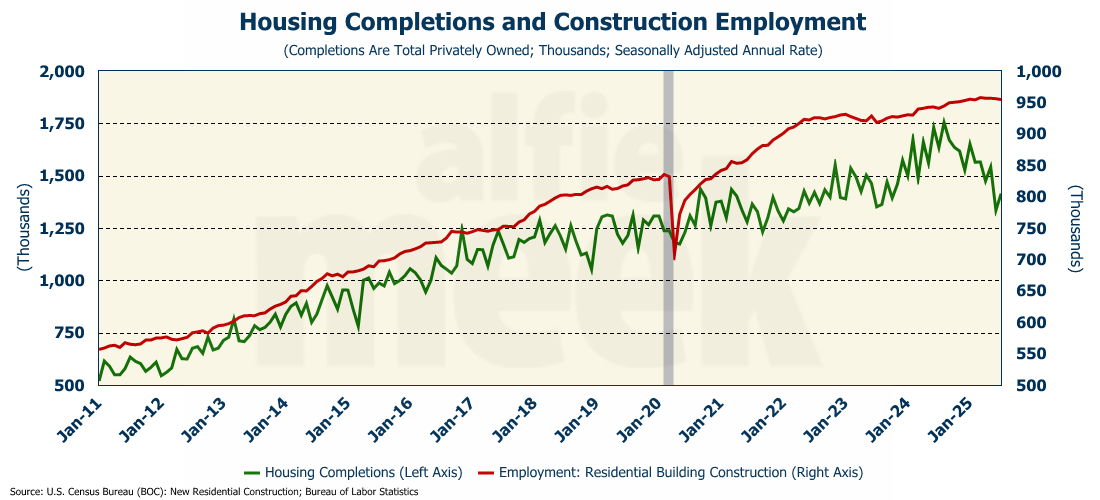
Whatever the reason, construction employment is starting to decline. And frankly, the construction jobs number has been suspect for a long time, given the level of activity. Perhaps the new BLS commissioner can take a look at this series as well. I suspect there are a lot fewer construction jobs than are being reported.
Existing Home Sales
The last bit of housing insight we got this week was data on existing homes in July, which rose very slightly to just over 4 million units on an annual basis (full release here). However, the median price fell over $2,600 to just under $407K. On a year-over-year basis, prices are up only 0.2%…virtually flat. By August, it is very likely we will see a year-over-year decline in the price of existing homes - something that hasn’t happened since mid-2023.

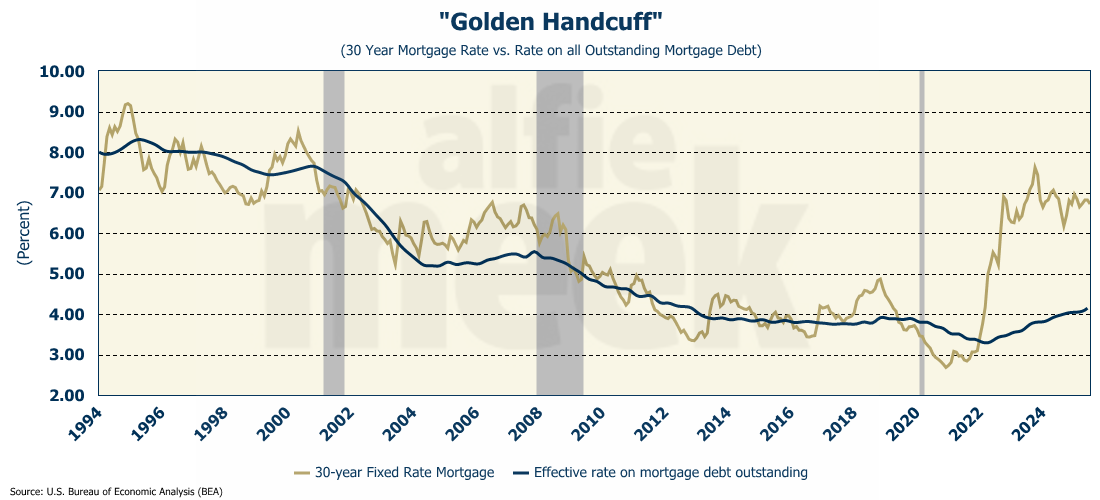
The effective rate on all outstanding mortgages is now 4.15% which is more than 260 basis points below the current 30-year mortgage rate. To be more specific, 87% of mortgage holders have rates below current rates, and two-thirds have a mortgage rate that is more than 200 basis points below current rates. Until that gap closes, existing homeowners are unlikely to release their existing mortgage and free up inventory.
What existing homeowners don’t realize is that prices are falling and, according to the National Association of Realtors Chief Economist Lawrence Yun, buyers “are in the best position in more than five years to find the right home and negotiate for a better price." That is, of course, if they can afford it. And, as discussed above, that is a big “if”.
Industrial Production
Lastly, this week, a brief comment on the industrial sector. In July, industrial production fell 0.1%. However, due to an upward revision of the June number, the annual increase in production rose to 1.43% - the largest annual increase since 2023 (full release here).
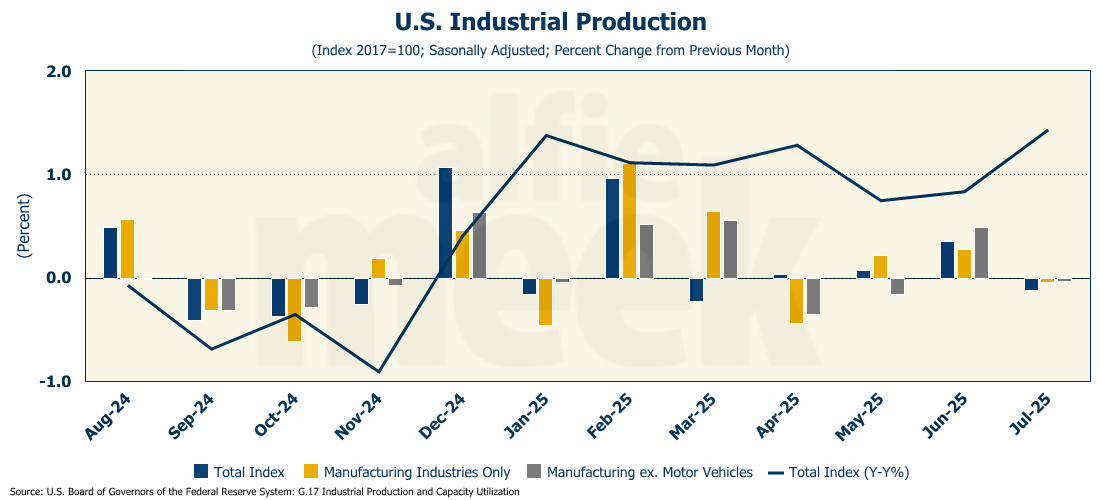
The production of manufacturing industries was down very slightly in the month, but again, the annual increase was 1.4%, the highest since October 2022. Given the increasing annual pace of growth in manufacturing and production, maybe all the fearmongering about tariffs was overblown? Most of the recent economic data suggests that is the case.
One More Thing…
I want to thank the Georgia Association of Zoning Administrators for having me out to their conference last week to discuss the fiscal impact of data center development on local governments. Good group with some great questions. (However, perhaps a rebranding is in order, as “GAZA” may not be the best acronym right now….)
As always, thank you for subscribing and reading this weekly update. At the beginning of 2025, my goal was to double my number of subscribers this year. So far, I am two-thirds of the way there. Please share with those whom you believe may find this information useful or at least interesting. And, if you do find it informative, I invite you to click/scan the QR code below to join as a “member” or to buy a coffee or two (or five) and support this effort.