Weekly Economic Update 09-05-25: ISM Manufacturing & Services Surveys; Factory Orders; JOLTS; and August Employment
Rates are moving up, inflation is rising, and the labor market is slowing. This isn't good.
The views and opinions expressed in this post are solely those of the author and do not necessarily reflect the views of the Georgia Institute of Technology or the Georgia Board of Regents.
After the long, hot August recess, Congress is back in session this week, and yet another government shutdown looms by the end of September. With Congress so deeply divided and evenly split, you might think that their focus would be on diligently working out a way to keep the government funded.
You would be wrong.
Apparently, of much more importance is disclosing the Epstein files. The prurient obsession with these “files” seems to be the only thing that unites both parties in Congress. If only they could generate as much interest in fiscal responsibility.
I dare to dream.
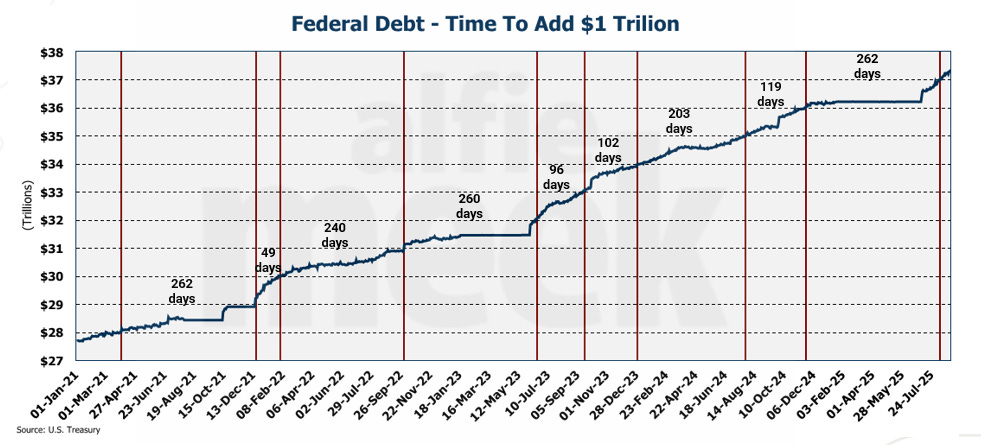
On August 11, the U.S. officially passed the $37 trillion mark with respect to the national debt. Since the spring of 2021, the U.S. has added $1 trillion to the debt roughly every 177 days, or just about every 6 months on average.
On September 17th, the Fed is likely to cut interest rates. However, the 30-year rate is RISING and is closing in on 5%. Think about that. We have rising interest rates in a market that has priced in a rate CUT. Why?
The media will advertise the coming rate cut as a “break for consumers.” It is anything but. The market understands that 1) the rate cut is going to result in higher inflation and 2) the government is going to continue adding $2 trillion to the debt each year. As compensation for both of these, the market is demanding higher yields in order to purchase government debt.
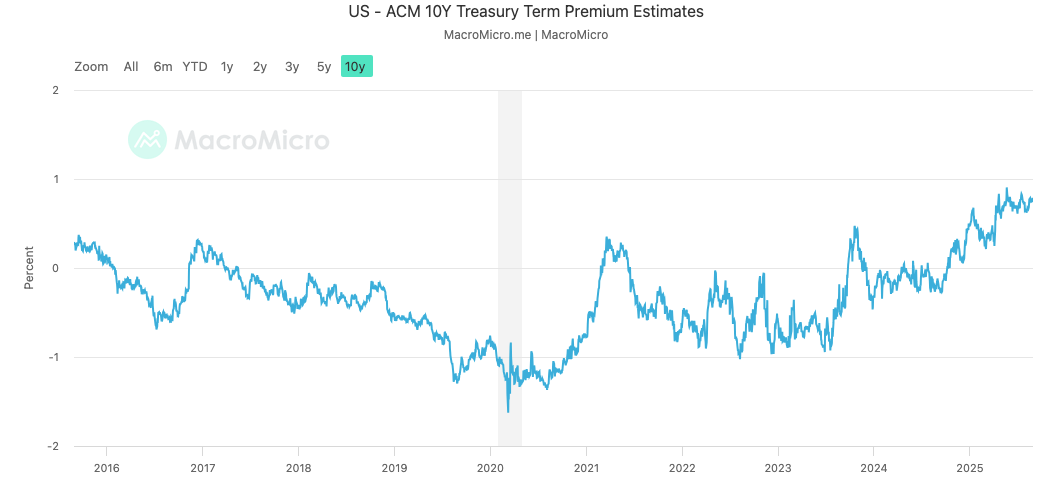
One way to measure this is to look at the “10-year Treasury term premium.” The term premium is the additional yield investors require to hold a long-term 10-year Treasury instead of constantly rolling over shorter-term Treasury securities. As such, this premium compensates investors for the interest rate risk and other risks associated with holding debt longer. As you can see below, the premium is now higher than it has been in more than 10 years.
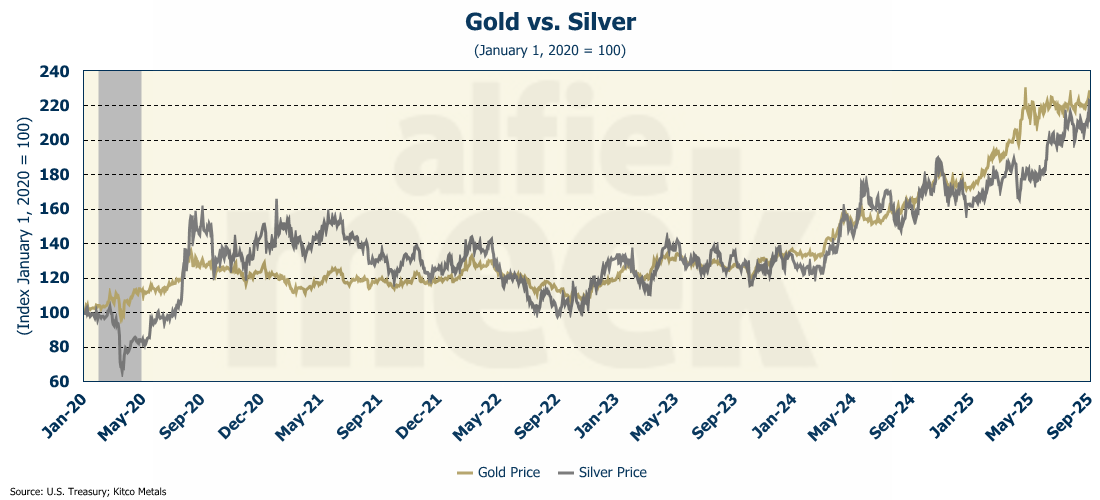
Not to state the obvious, but we have got to get our federal spending under control. Not only is the bond market telling us this, but so too are gold and silver, both of which are up more than 120% since January 2020. That compares to the S&P, which is up 97% over the same period.
We are in a slow-motion currency collapse in this country, driven by our ever-expanding federal debt. In a period of rising inflation, you want to hold assets, not cash. Price increases across dozens of asset classes, as well as bond yields, tell us that the markets sees more inflation coming. Further, as you will see below, the labor market is signaling a potential recession. Combine those two, and you get stagflation. Younger people today haven’t lived through a period of stagflation, but those who have know what a problem it can be. Policies designed for slow growth tend to worsen inflation, and vice versa. That makes stagflation tough to fight. And we appear to be headed in that direction.
But, hey, as long as we get the Epstein files…
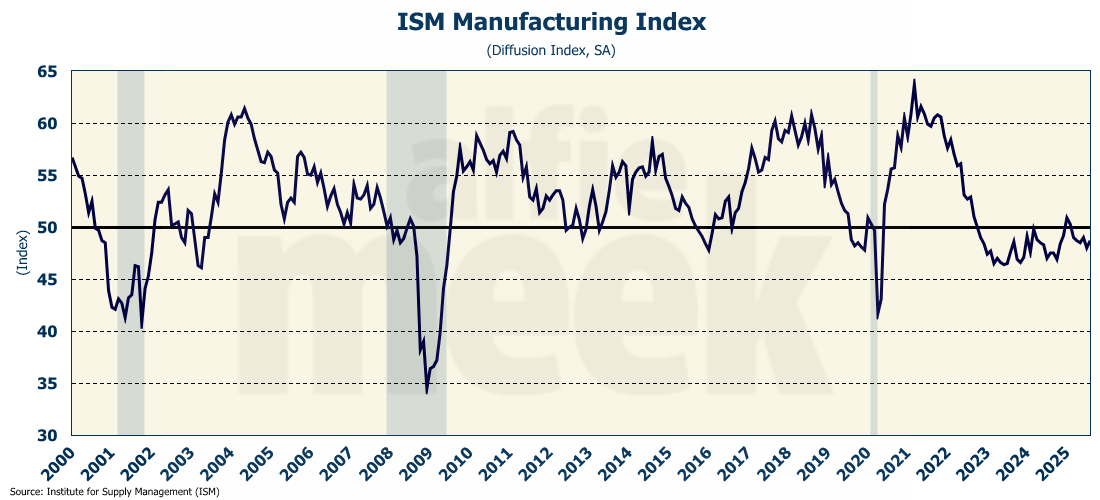
ISM Manufacturing
The ISM Manufacturing survey rose slightly in August, but remains below 50. (For a diffusion index, a reading below 50 means the sector is contracting, and above 50 it is expanding.). With the exception of a one-month rise above 50 in January, the index has been in contraction territory since October 2022 (full release here).
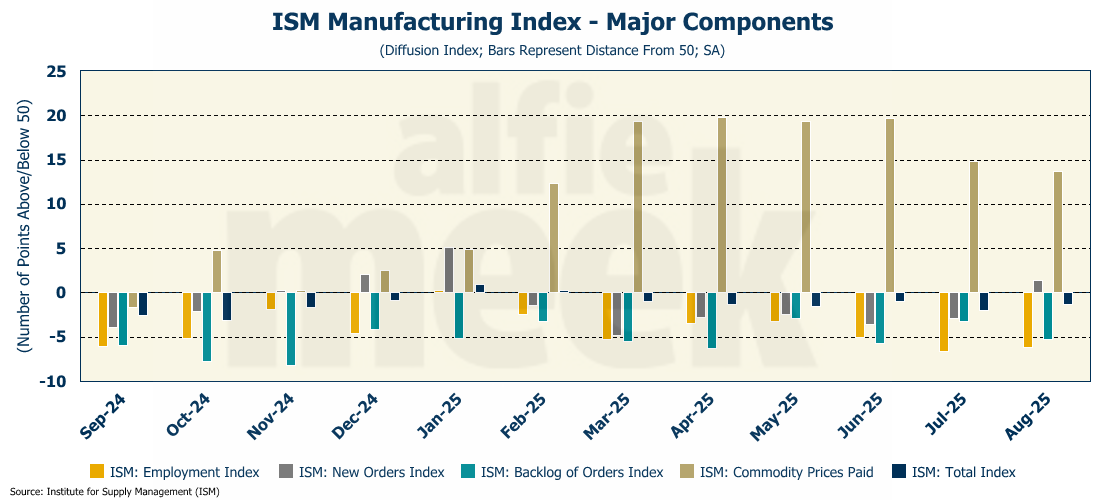
Looking at the details, we see prices paid falling sharply from where they were just two months ago. The new orders index improved, moving above 50 for the first time since January. However, manufacturing employment continues to be weak.
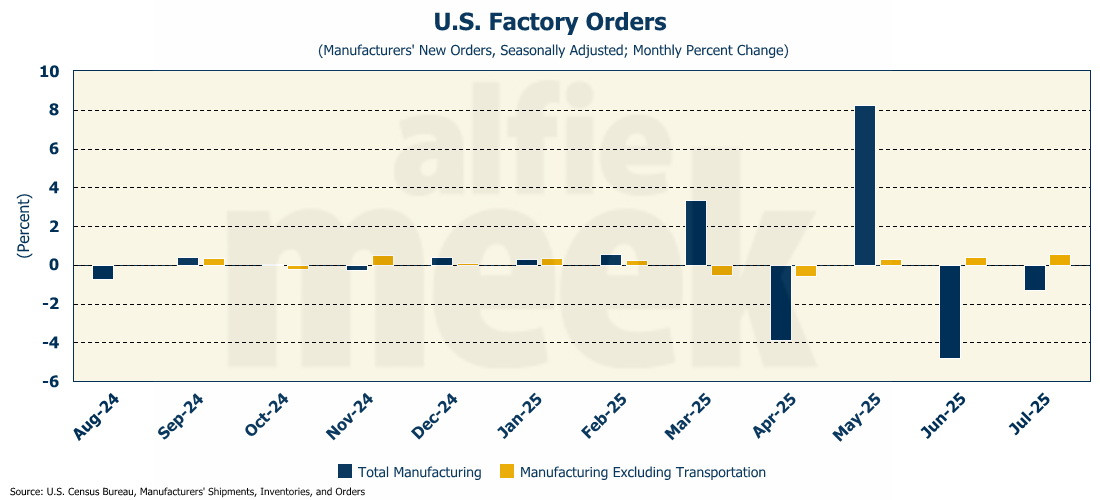
Factory Orders
While the ISM Manufacturing Survey may be showing some improvement, actual factory orders in July did not (full release here). For the second month in a row, factory orders fell, dropping 1.3% as expected. It was expected because manufacturing activity is still recovering from the May jump in orders as companies tried to beat the tariffs. Even so, core orders (orders less transportation) came in at 0.6% for the month, rising for the third month in a row.
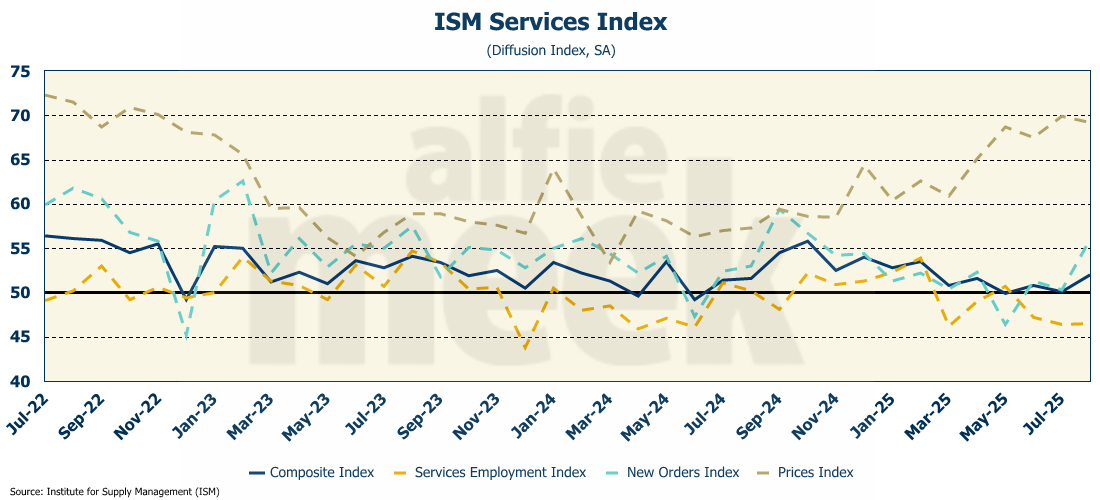
ISM Services
If manufacturing showed weakness in August, the same can’t be said for the service sector, according to the latest ISM Services survey (full release here). The survey rose to 52, which is the best reading since February. Like the ISM manufacturing index, this is a diffusion index, and a reading above 50 indicates that the service sector is expanding. Digging a little deeper, we see that the price index declined, and the new orders index rose to its highest level since last October. Unfortunately, the employment index was virtually flat and remains well below 50. That is consistent with other recent labor market data.
Job Openings & Labor Turnover Survey (JOLTS)
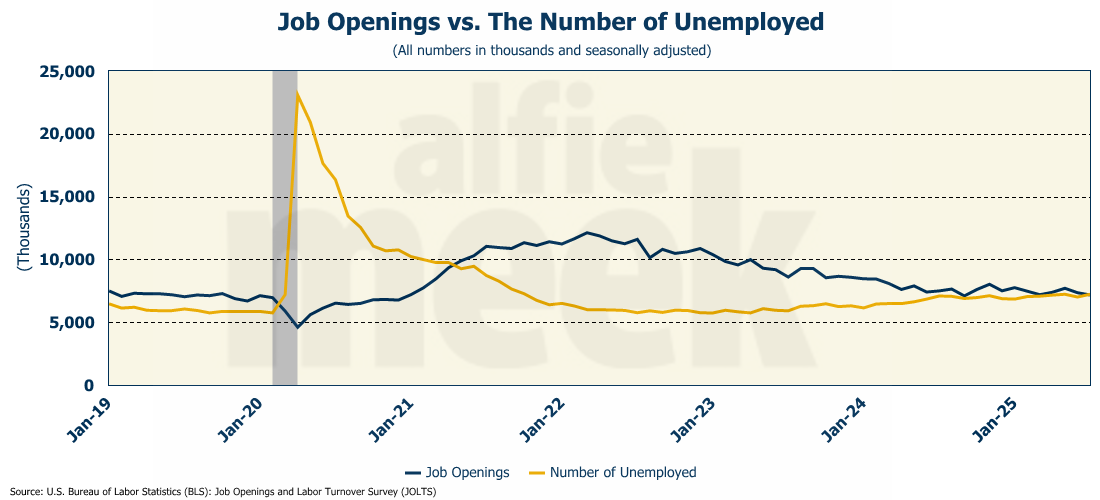
We have crossed a critical threshold in the labor market. In July, the number of job openings fell by another 173K to 7.18 million (full release here). The number of unemployed currently sits at 7.24 million. In other words, there are more unemployed people than job openings. That hasn’t happened since April 2021. As I have often pointed out, the U.S. has never entered a recession where there were more job openings than unemployed workers (i.e., the job market was supply-constrained). Well, as of July, we are no longer in that situation.
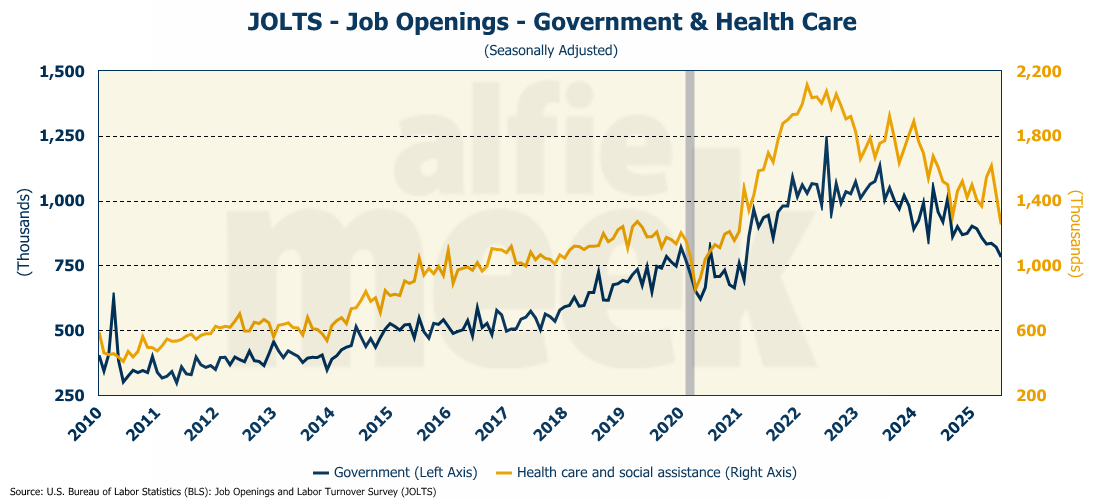
The number of job openings declined sharply in both healthcare and government sectors, both of which represented the bulk of the job growth over the past four years. Job openings for both sectors are at or near pre-COVID levels.
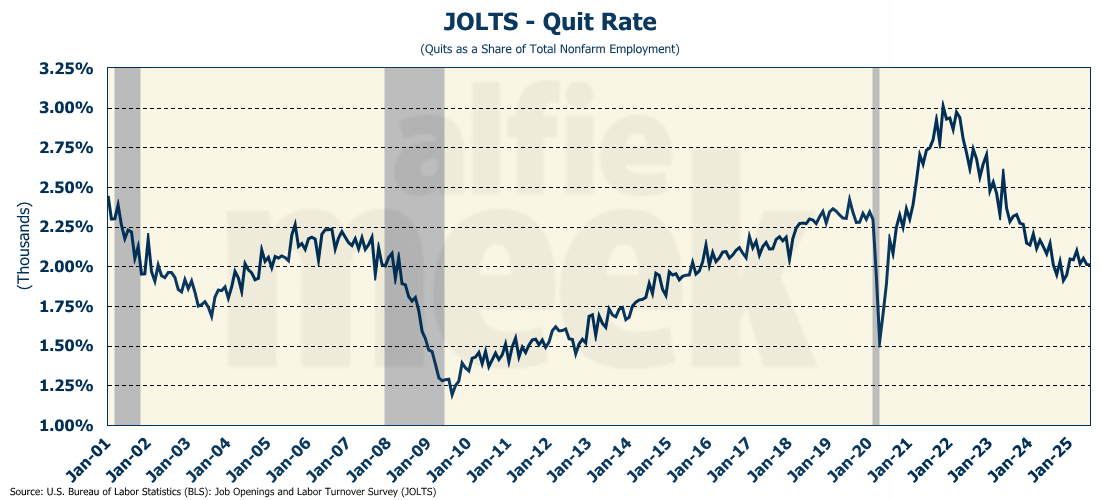
Another sign of a tightening labor market is the quit rate, which is now down to 2.0% - well below where it was pre-COVID. Obviously, if people feel that jobs are hard to find, they are less likely to jump ship from their current employer.
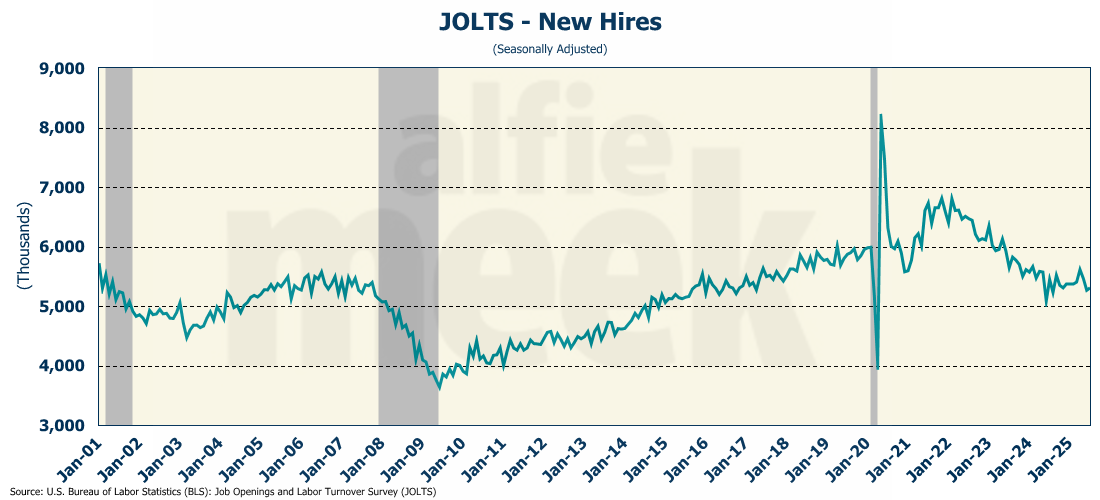
One bit of positive news in the report - the number of new hires did tick up slightly in July, rising 41K.
That leads to the big release of the week, the August employment report…
August Employment
…which was dismal. According to the Bureau of Labor Statistics (BLS), the economy only added 22,000 jobs, and the unemployment rate rose to 4.3% (full release here). That was WAY weaker than expected. Further, the previous two months were revised DOWN by a total of 21K. The June revision turned that month negative…the first negative month for employment since December 2020!
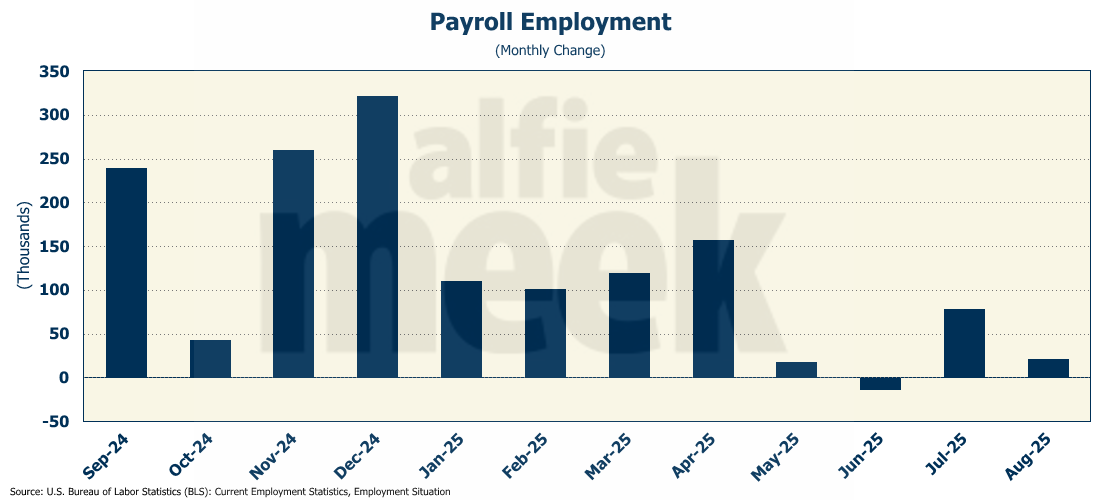
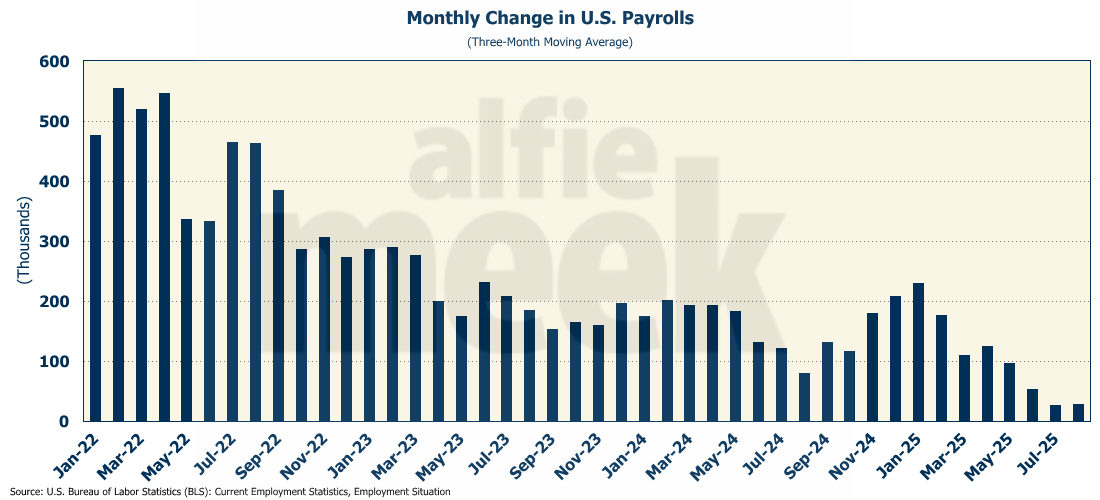
Of course, who can believe anything coming out of the BLS lately? Because the revisions are often so dramatic, I have taken to following the three-month moving average, which takes into account all the previous revisions. On a three-month moving average basis, the economy has created fewer than 30K jobs for the last two months.
Both manufacturing and construction employment declined in August. The largest gain was in health care, which added nearly 31K jobs by itself. Not surprisingly, the Federal government dropped another 15K jobs in August, the sixth month in a row that Federal employment has fallen. Since January, Federal government employment is down more than 80K…a drop in the bucket, but certainly a move in the right direction.
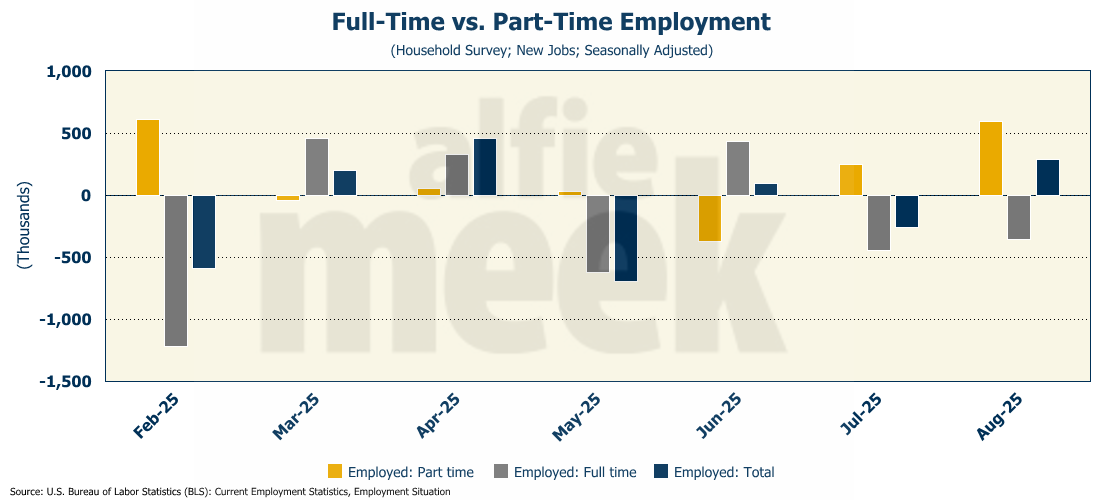
Ironically, the household survey wasn’t quite as bad with household employment UP 288K. Even so, the unemployment rate rose to 4.3% - the highest level since late 2021. However, as was the case for much of the past several years, the growth was in part-time jobs, which rose nearly 600K while full-time employment fell by nearly 360K. That is the second consecutive month we have seen that pattern, and it is yet another sign of a weakening labor market.
And finally, here is an interesting note….since March, foreign-born employment is down 1.4 million, while native-born employment is up 1.3 million over the same period. I’ll let you interpret that as you will.
One More Thing…
Last week, in response to my recognition of Tommy Jennings as the first person to “officially” reach the 10 referral mark, another of my long-time supporters, Matt Forshee, posted on LinkedIn that since he referred Tommy, he is claiming all of Tommy’s referrals! In all honesty, Matt’s posts on LinkedIn have probably driven more people to this weekly blog than just about anyone except Dan McRae.
However, as Matt points out, you only get “official” credit if you use the referral link below. Matt added that to his LinkedIn post, and I have spent the entire week getting new subscribers referred by Matt, and Matt is moving up the leaderboard. In fact, he started the week not even on the leaderboard, and at this point, the only person ahead of Matt is the aforementioned Tommy Jennings and an “anonymous reader,” which I find somewhat humorous. (If you think you are the “anonymous reader,” please let me know! I want you to get the credit you deserve!)
On the first post of the month, I like to recognize my gold and silver members. Special thanks to my two “gold” level members, Andrew Hajduk and Beth Truelove, with the White County Chamber of Commerce, and my three “silver” level members, Dan McRae (mentioned above), Chuck Fitch, and Greg Whitlock. Their support helps cover the costs associated with putting this together each week.
If you are a regular reader and find this useful, please consider a monthly membership. I invite you to click/scan the QR code below to join or just “buy a coffee!”