Weekly Economic Update 09-06-24: The Economics of Elections; ISM Manufacturing & Services Indices; Factory Orders; JOLTS; and August Employment
The views and opinions expressed in this post are solely those of the author and do not necessarily reflect the views of the Georgia Institute of Technology or the Georgia Board of Regents.
We are now only two months away from the 2024 Presidential election. I suspect those are going to be two intense months as we are bombarded with television ads, junk mailers, spam texts, phone calls, and possibly tense discussions with family and friends.
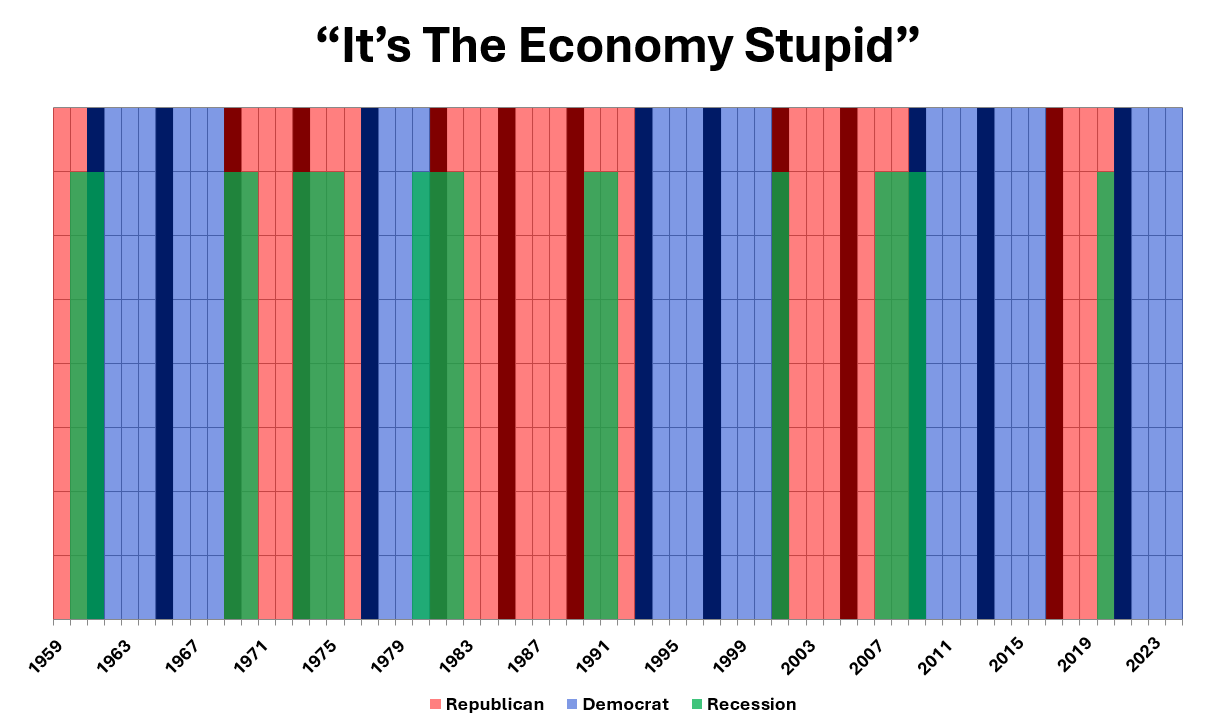
As a professional economist, I have been speaking to groups for more than 25 years and every time the Presidential election rolls around, I like to bring out the following chart:
To quote James Carville, when it comes to the Presidential election “it’s the economy, stupid.” And the chart above shows exactly that. Each column above represents one year. The darker shaded columns represent year 1 of a Presidential term. The green shaded areas represent “official” recessions. And the colors obviously represent the party in office - red for Republican and blue for Democrat.
Here is what the chart clearly shows. Since 1960, if you have a recession in the 3rd or 4th year of your term, your party loses the White House. Period. There are no exceptions to this rule.
Similarly, if you don’t have a recession, or can contain any recession to years 1 or 2 of your term, your party WILL retain the White House, but only IF the person running is an incumbent. Period. There are no exceptions to this rule.
However, even if you can avoid recession, or contain it to years 1 or 2 of your term, but you run a non-incumbent, your party is likely to lose. In fact, the only time this didn’t happen was George H. W. Bush in 1988. Every other time, even with a good economy, the incumbent party lost when the incumbent wasn’t running.
1968 - Johnson drops out late because of Vietnam and the party ran Humphrey
2000 - Clinton was term-limited and the party ran Gore
2016 - Obama was term-limited and the party ran Clinton
Quite interesting if you think about it. What does this tell us? Well, if the trends hold, and we are currently in a recession, then the Republicans will win the White House.
Conversely, if we are not in a recession (which seems to be the prevailing wisdom) then the best bet for the Democrats would have been to run the incumbent, Joe Biden. Again, since 1960, 100% of the time, the incumbent wins in that situation.
But, they didn’t do that. Instead, they are running a non-incumbent - Kamala Harris. Even with a good economy, that has only worked one time since 1960.
It will be interesting to see if the economics of Presidential elections holds up in 2024, or if this time the voters defy the norm. Hold on to your hat…it is going to be a wild ride.
ISM Manufacturing
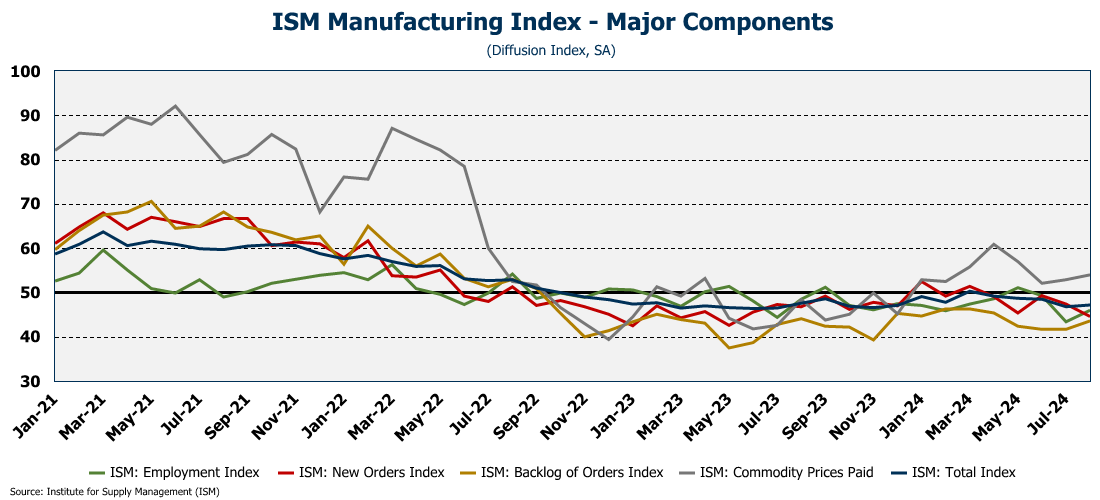
Manufacturing in this country continues to suffer with the ISM Manufacturing index moving just a tick up to 47.2 in August (full release here). With the exception of one brief blip in March, the index has been below since October 2022, and indication that the sector has been contracting for nearly two years.
Again, this is a diffusion index so any reading below 50 represents a contraction and a reading above 50 represents an expansion. And, given the importance of manufacturing, those readings correspond pretty well to overall economic activity.
However, the best part of the release this month is that the ISM (Institute for Supply Chain Management) tried to gas-light everyone by suggesting that the economy is doing well, despite the decline in manufacturing. I quote - “a manufacturing PMI above 42.5 percent, over a period of time, generally indicates an expansion of the overall economy." Really? Ok, just so I am clear…since the history of the index going back to 1948, 50 was the breaking point - below 50 manufacturing was declining; above 50 manufacturing was expanding. And those have always corresponded to turns in the business cycle. Which is why the ISM New Orders Index is actually a component of the Index of Leading Indicators! But now, the ISM is saying, “well, manufacturing may be in decline, but as long as we don’t drop below 42.5, the overall economy should still be in good shape.” (I bet the people who put together the Leading Economic Index were happy to hear that!)
So that is their explanation as to why manufacturing has been in decline for two years, but the U.S. economy has not fallen into recession. I guess there several options to consider here. Either 1) manufacturing just isn’t as important to the economy as it used to be, and as such, 42.5 is now the point to which manufacturing has to go before the entire economy is in decline; 2) the index is broken and misrepresents the actual conditions in the manufacturing sector; or 3) the index is fine, but ISM is trying to explain why manufacturing is tanking and, according to the official arbiters of recessions, the economy has not.
If you look at the graph below, you will see that during “official” recession the index did get down to 42.5 (green line). But one wonders if ISM looked at the same graph and just decided that 42.5 seemed like it fit the historical data. It kind of feels that way to me.
Digging into the report, there are two areas of concern. First, the new orders index plunged at its fastest rate since May 2023. Obviously, no new orders suggests continuing weakness in the coming months. And second, the prices paid sub-index rose for the second month in a row. I realize I keep harping on this, but inflation is not beaten. And the rate cut that is most assuredly coming later this month is going to make inflation worse.
Factory Orders
On first glance, the factory order data we got this week would appear to contradict the manufacturing data as orders were up an astonishing 5% in July following two consecutive months of decline (full release here). However, if you exclude transportation orders (which tend to be huge and very volatile month-to-month) orders were up only 0.4%. Orders for non-defense capital goods actually fell 0.1% providing more evidence that businesses are not currently investing in new capital.
ISM Services
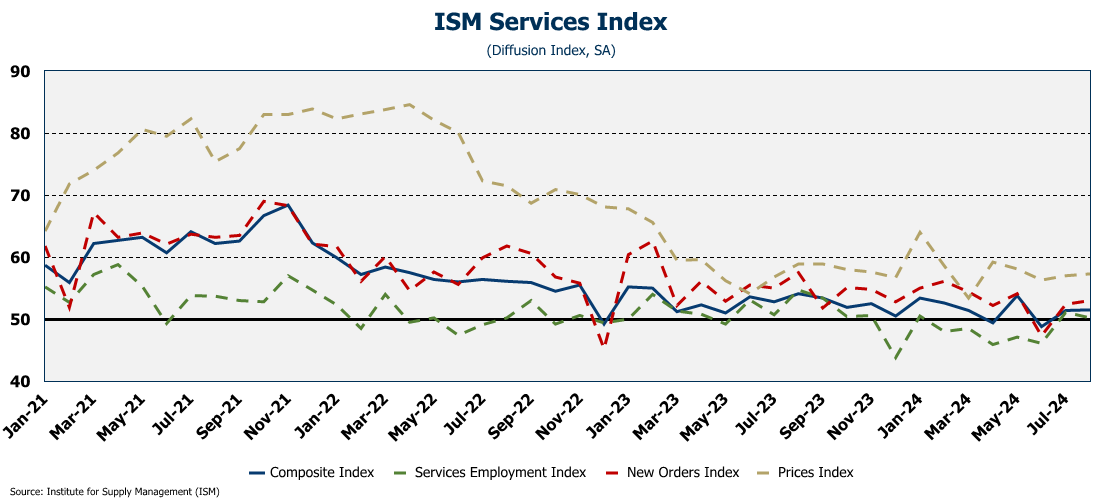
The ISM Services index rose very slightly in July from 51.4 to 51.5 as it stayed above 50 for the second month in a row (full release here). The bright spot in the report was that the index for new orders rose slightly. However, the employment index declined and, even more concerning, as was the case with the ISM manufacturing index, the prices paid index rose. When the Fed cuts rates later this month, it is only going to lead to further inflation and price increases.
Referring back to the ISM Manufacturing index, the release did provide a warning - “the recent downturn in manufacturing activity is showing some signs of spilling over to the broader economy, notably via stalled orders for industrial services.” But wait! I thought that as long as the ISM Manufacturing index was above 42.5, everything was good! Now I am really confused. (Or perhaps the folks at the ISM are the ones who are confused….or trying to pull a fast one and hope you won’t notice.)
Job Openings and Labor Turnover (JOLTS)
The labor market is definitely getting tighter as the number of job openings plunged to 7.67 million in July - the lowest level posted since January 2021 (full release here). Remember back in 2022 when there were 2 job openings for every one person unemployed? We had the “great resignation” as everyone was quitting to find a better job and the labor market was wide open and people could dictate their salary. Not any more. In fact, we are getting close to parity between job openings and the number of unemployed, and in a matter of months, we will be back to a situation where those looking for a job will outnumber the jobs available.
One interesting note….the number of job openings in construction is absolutely crashing and has completely disconnected from the level of employment being reported in the construction sector. In the coming months, expect to see significant job losses in the construction sector, especially with the slowdown in housing.
August Employment
This morning we got the August employment numbers and they came in slightly below expectations at 145K. However, on a positive note then unemployment rate did drop slightly to 4.2% (full release here).
As regular readers know, I like to look at the 3-month moving average in employment growth due to large revisions a month or two after the fact. In fact, in this latest report, the June number was revised down 61K and the July number was revised down 25K. So combined, there were 86K fewer jobs created than initially reported. Six of the seven previous months have been revised down. Taking these revisions into account, on a moving-average basis, employment growth is grinding to a halt.
If there is one bright spot here it is that this probably wasn’t bad enough for the Fed to cut 50 basis points later this month. Frankly, there is no reason for them to cut at all, but at this point, it seems inevitable. Even so, the damage should be limited to only 25 basis points.
Final Thoughts
My plan for some time as been to transition in October to a subscription model to help support the cost of putting this together on a weekly basis. A HUGE “thank you” to those who have already committed $8/month for a paid subscription. However, despite the fact that there are hundreds of people reading each week, only a handful of you have pledged, and certainly not enough to justify continuing. I need a BIG jump in pledged subscribers this month, otherwise, it may be time to wrap this up. If you share this with others who find it valuable, please encourage them to pledge for a paid subscription.
Thanks again to all those who are already supporting this effort through the “buy me a coffee” until I move to paid subscriptions! Special thanks to Tommy Jennings who contributes regularly. (If enough people did this each week, I may be able to continue under this model!). If you enjoy this update please click image below to support my efforts.
Until next week….
.


