

Weekly Economic Update 1-03-25: Consumer Confidence; Durable Goods; New Home Sales; and Case-Shiller Home Prices
Pessimistic consumers and weak manufacturing data, but new home prices are trending down
The views and opinions expressed in this post are solely those of the author and do not necessarily reflect the views of the Georgia Institute of Technology or the Georgia Board of Regents.
Happy New Year!
Let’s be honest…2024 was crazy, and I for one am happy to be starting fresh and cautiously excited about what 2025 has in store. The subscriber base for this weekly update grew 465% in 2024, but even with that growth, it fell 5 subscribers short of my goal. In 2025 I would like to double the subscriber base and if you keep sharing it, I think that is easily achievable. To start the new year, I am going to turn on comments this week and I welcome any feedback you have to make this weekly newsletter more useful in 2025.
Thanks to my good friend Chad Teague who covered for me last week. I hope to have a few guest writers this year to 1) give me an occasional break and 2) to get some new perspective mixed in on topics of interest. Stay tuned.
With New Year’s Day falling right in the middle of the week, there wasn’t much data released this week, but here is what we got for the first week of the year…
Consumer Confidence
An inauspicious start to the new year as consumer confidence unexpectedly plunged in December to 104.7 - the largest single-month decline since August 2021 (full release here). The drop was driven by a large downswing in consumers’ expectations about the future of the economy.

Digging into the data, it turns out that rather than be a gauge in overall consumer feelings about the future economy, it is more of a post-election political statement.
The University of Michigan actually breaks their consumer sentiment data down by party affiliation. Unfortunately, the Conference Board does not. However, they do break it down by region. Consumers in both New England and the Mountain west region saw confidence plunge, while consumers in the middle of the country, and the south, saw confidence surge. Further, looking at individual states, those dominated by Democrats like New York and California saw their consumer expectations plunge while consumer expectations in Texas went through the roof. Until things settle down, I’m not sure that the consumer expectations data from the Conference Board, nor the consumer sentiment data from the University of Michigan, are going to be very useful as actual gauges of consumer behavior.
Durable Goods
I can explain the drop in consumer confidence as a function of politics. But that doesn’t work for the latest advanced data on orders for durable goods. Expectations were for a slight decline of 0.3% for November, but the data came in down 1.1% (full release here).
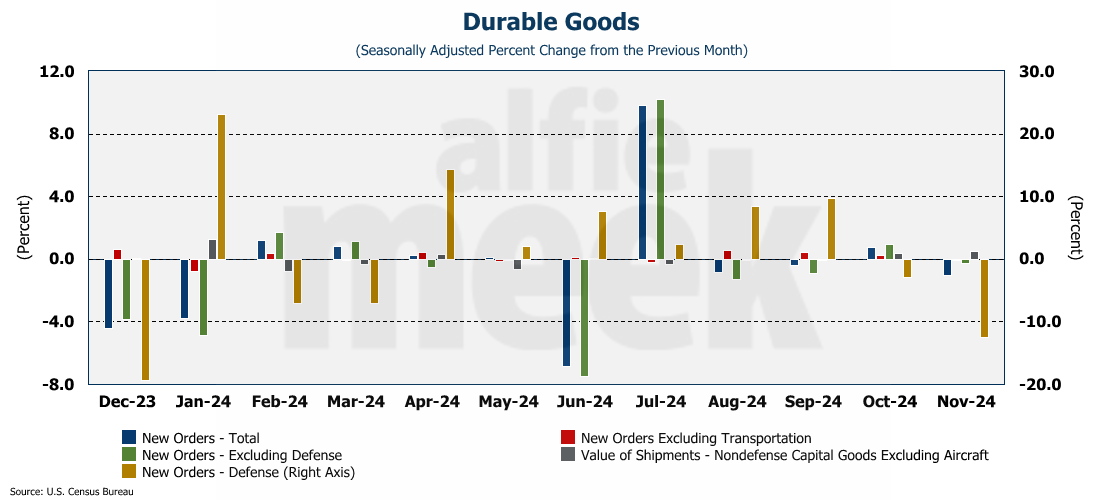
On a year-over-year basis, orders were down 5.2% below 2023. However, if you exclude orders for transportation goods, order were up 1.5% over last year. Simply put, orders for commercial aircraft tumbled in November and brought down the overall numbers. But it wasn’t only commercial aircraft. New orders for defense goods fell 12.5% in November, the largest monthly drop since last December. If you excluded both transportation and defense, durable goods orders would actually have been up 1.2% for the month.
New Home Sales
New home sales rebounded slightly in November rising 5.9% to 664K units on an annual basis (full release here). That is 8.7% higher than last November. Even so, the increase was well below the expected rate of 675K units. The median price on a new home fell to $400,908…the second lowest level since September 2021. The median price trend is clearly sloping down from the peak in October 2022, although the drop has been gradual.

I have said before, this is no longer a supply issue as the number of new completed homes for sale continues to rise and is now at 120K units - the most since August 2009. It is an affordability issue as the 30-year mortgage rate averaged 6.8% in November. Wages have simply not kept up with the increase in home prices.

It is absolutely fascinating to see that since late September, the Fed has cut interest rates 100 basis points, but the 10-year treasury is UP 80 basis points and the 30-year mortgage is UP 76 basis points. That is not the way that it was supposed to work….at least not the way the Fed hoped it would work.

Case-Shiller Home Price Index
Finally, we got the latest edition of the Case-Shiller Home Price Index (full release here). Prices in the 20 largest metro areas were up 0.3% in October. (Remember that the Case-Shiller data lags considerably.) Although they were up, the pace of annual growth continues to slow with prices up only 4.3% over October 2023 in these 20 metro areas. Nationally, prices are up 3.6% year-over-year.
With respect to prices, the national price index has now fallen for 3 consecutive months, lending evidence to the idea that prices are starting to come down, however slight the decreases may be. However, for the 20-major metros, prices continue to rise.

On a regional basis, 18 of the 20 major metros posted price gains in October, with only Tampa and Cleveland falling. Prices in Atlanta, Dallas, Miami, and even San Francisco are growing slower than the national average while New York, Boston, Chicago, and even Charlotte are growing faster.

One More Thing…
With the new year comes the flurry of speaking engagements where I discuss the economy and my outlook for 2025. The first three in January are all private events, but in late February (24th), I am scheduled to speak at the LaGrange-Troup County Chamber Economic Outlook Luncheon. (Although, it isn’t showing on their website so I don’t know if they are still holding the event.) In March I will be speaking to the Barrow County Chamber (3/4) and then the Partnership Gwinnett Economic Outlook lunch on 3/17 in Duluth. If you attend any one of these events, please come up and say “hello.”
On the first post of the month I try to recognize my gold and silver members. Special thanks to my “gold” level member Andrew Hajduk and my two “silver” level members Dan McRae and C. Fitch (don’t have a full first name). Their support helps cover the costs associated with putting this together each week. If you are a regular reader, and find this useful, please consider a membership. I invite you to click/scan the QR code below to join or just “buy a coffee!”

Next week, I’ll send out a “thanks” to all my “bronze” level members. Until then, thanks to everyone for all the support!

Here's a continuous improvement suggestion, since that's what we do down here at the MEP:
When there is a chart with two pieces of data graphed against dual Y-axis, each Y-axis could be color coded to match the color of the data it represents.