Weekly Economic Update 1-19-24: Manufacturing Survey, Capacity Utilization & Industrial Production; Retail Sales; Home Builder Confidence, Housing Starts & Building Permits; and Consumer Sentiment
The views and opinions expressed in this post are solely those of the author and do not necessarily reflect the views of the Georgia Institute of Technology or the Georgia Board of Regents.
The Iowa Caucuses are behind us and by any measure, the Presidential race has begun in full measure. This isn't a political newsletter, but let's be honest....the economy will loom large in the 2024 race for the White House. Hopefully the Fed won't put their thumb on the scale and will play it straight with their policy decisions. But that may be too much to expect. In any event, there was a lot of data released this week, so given time and space constraints, I'll focus on the highlights...
Empire State Manufacturing Survey
This is the first time I have mentioned the Empire State Manufacturing Survey in the weekly update. That is mainly due to the fact that it is focused on conditions in the manufacturing sector in the northeast, specifically New York. However, the data this week on the survey was just too significant to ignore. The index plummeted to -43.7 which is the worst result since the index began, excluding the COVID lockdowns when manufacturing plants were essentially shut down. We noted two weeks ago that, according to the ISM Manufacturing Index, manufacturing is in an extended contraction - the longest since the 2000-01 recession. The "general business conditions" part of the New York Fed survey confirms that a majority of manufacturing CEOs believe the overall manufacturing environment worsened significantly from last month, which was also down.
But that isn't all. What makes this so significant is that expectations were for an IMPROVEMENT in the index. The actual results were more than 10 standard deviations below expectations....a statistical asymmetry if ever there was one. The crash was lead by new orders which plunged more than 38 points to the lowest level since April 2020. The shipments index fell by the largest amount since last August, and, despite all we are hearing about slowing inflation at the producer level, the index of prices paid for materials jumped to a three-month high. (I think I trust the word of the CEOs who are writing the checks over that of bureaucrats at the Department of Labor.....)
Capacity Utilization and Industrial Production
Further indication of the poor state of manufacturing came from the Federal Reserve this week when they released the December capacity utilization rate. Capacity utilization measures the percentage of the nation's output potential that is actually being realized. Another way to look at it is that it gives an indication of the amount of slack in the system at a given point in time. The capacity utilization rate fell to 78.6%, its lowest level since September 2021. The manufacturing index declined slightly and has been virtually flat at 77% for the last three months.
Even so, manufacturing production rose slightly (0.1%) in December, which was better than expected. However, for the fourth quarter as a whole, manufacturing declined 2.2%, but that was mostly due to the UAW strike in October. Excluding motor vehicles, factory output actually declined 0.1% in December, and was down 0.3% for the final quarter of 2023.
Retail Sales
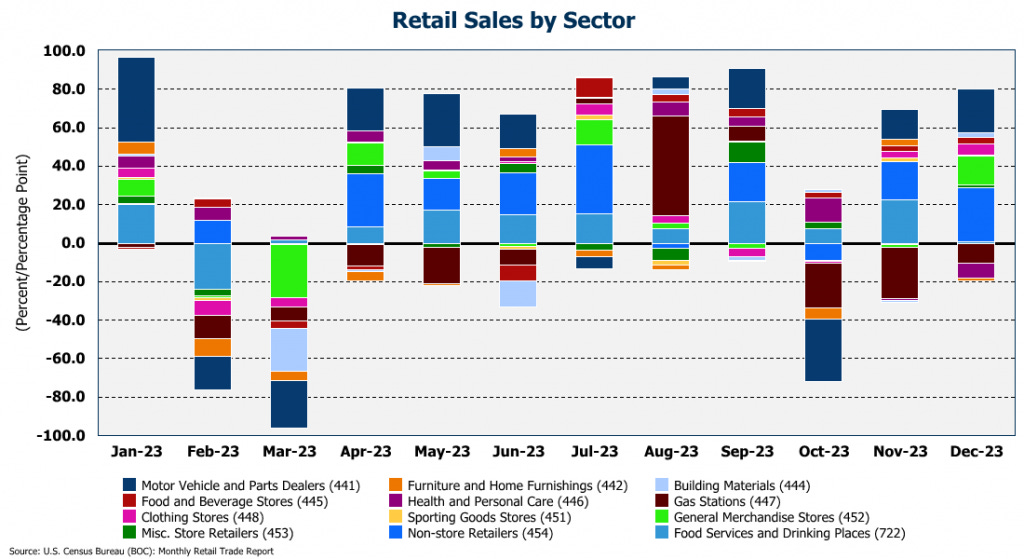
Given the explosion of consumer debt that I reported on last week, it is not at all surprising that retail sales for December jumped 5.6% on a year-over-year basis, the largest increase since January. Even adjusted for inflation, retail sales were up 2.3% from December 2022, the second month in a row real retail sales were positive, after being negative for most of the year. In fact, for the year, real retail sales were up only 2.2%...better than the decline posted in 2022, but that is the weakest growth since 2018.
However, it is clear that the Christmas shopping season was far more robust than I was expecting. As I discussed last week, the consumer just keeps on spending with total consumer credit now in excess of $5 trillion; $1.3 trillion of which is revolving debt. On a month-to-month basis, gas stations, personal health care, and furniture stores saw sales decline while motor vehicles, general merchandise, and non-store retailers saw sales surge over November. With retail sales growing at such a robust rate, the Federal Reserve is even less likely to cut rates anytime soon - also something we discussed in the update last week.
Home Builder Confidence
The National Association of Home Builders reported this week that builder confidence surged for the second month in a row in January as mortgage rates continue to fall. The 30-year fixed-rate average for January is sitting around 6.6%, the lowest it has been since May. As can be seen below, home builder confidence tends to move right along with the mortgage rate. The index for January came in at 44, up 8 points from December. Last January, the index was at 35. However, even with the improvement in overall sentiment, about 62% of builders were using incentives (other than price cuts) to improve sales in January. About 31% of builders said they cut prices in January (at an average of about 6%), but that is down from the 36% that reported cutting prices in December.
Housing Starts and Building Permits
Despite the confidence of home builders, and expectations of an increase, housing starts actually turned down in December to an annual rate of 1.46 million units. (That is how many houses would be built in a year at the pace set in December.) That was the first decline in four months and represented a drop of 4.3% from November, but was 7.6% ABOVE December 2022. Single-family permits lead the decline, dropping 8.6% from the pace set in November.
Building permits, a good indicator of future construction, rose 1.9% in December to a rate of 1.5 million. Single-family permits grew for the 12th month in a row! Multi-family permits were also up, driven by a huge jump of 10.6% in homes with two to four units, (e.g., duplexes and townhomes). Multi-family permits for homes with 5 units or more (e.g., apartments) grew only 1.4%.
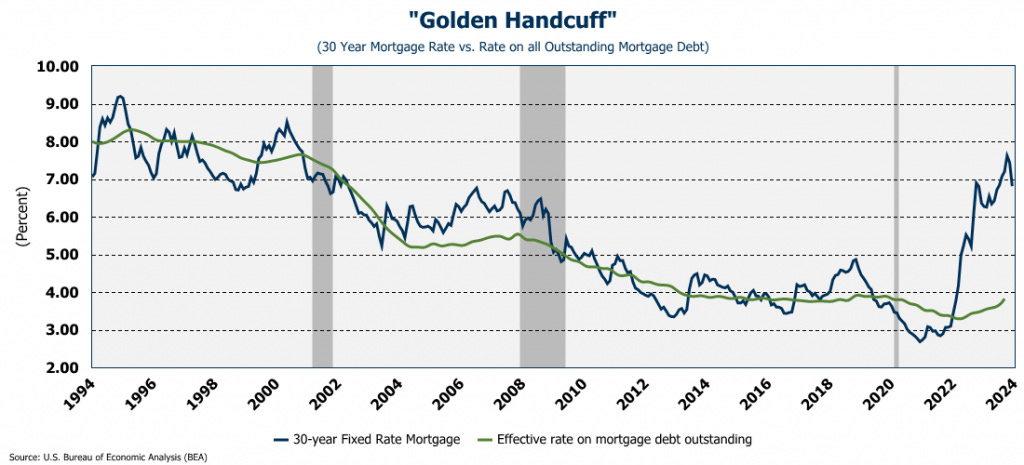
Even with the recent decline in mortgage rates, the rate gap between existing mortgages and a new mortgage is still far to wide to spur current home owners to bring supply to the market by putting their home up for sale. As such, demand will have to be satisfied by new construction which means that home construction activity should continue into 2024.
Consumer Sentiment (Preliminary)
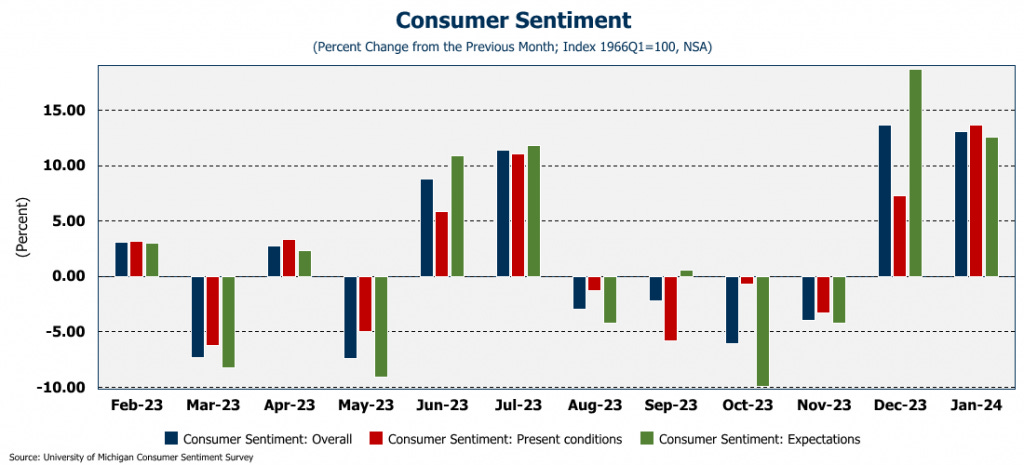
I'll wrap up this week with the preliminary University of Michigan Consumer Sentiment survey which absolutely exploded from 69.7 in December to 78.8 in January. That is the highest level since July 2021. That is the second month in a row that consumer sentiment has risen significantly and reflects consumers feelings that inflation has been conquered and is slowing down. In fact, expectations for inflation 1-year out dropped to their lowest level since December 2020, (and that was before inflation took off in early 2021). Further, the expectations for inflation 1-year out are roughly the same as the expectations for 5-years out. Clearly, consumers think that inflation is behind us. I hope they are right, but I don't think they are.
One More Thing...
As a reminder, I will speaking at the Southwest Gwinnett Chamber’s First Friday Breakfast on February 2 where I will be giving an economic update/outlook for 2024. Also, for the third year in a row, I will be giving the keynote address at the Partnership Gwinnett Economic Outlook luncheon, tentatively set for March 21st. Both of these are open to the public. Hope to see you at one or both of these events!


