Weekly Economic Update 1-26-24: Leading Economic Indicators; Durable Goods; Personal Income & Spending; PCE Inflation; New Home Sales; and 4th Quarter GDP
The views and opinions expressed in this post are solely those of the author and do not necessarily reflect the views of the Georgia Institute of Technology or the Georgia Board of Regents.
I want to start with a quick welcome to all the new subscribers we have added in the last week or two! Thanks for subscribing and if you find this at all interesting or useful, I hope you will share it across your personal and professional network.
There was a lot of economic data released this week, so I will focus on the highlights, ending with our first look at 4th quarter GDP.
Leading Economic Indicators
The Conference Board's Index of Leading Economic Indicators index of leading indicators is designed to provide a future view of the economy, and traditionally it moves in a downward trend prior to a recession (graph below – gray bars indicate “official” recessions). The index fell for the 21st consecutive month in December. Again, that is 21 consecutive months! In the 2007-08 economic collapse, it fell for 22 consecutive months, so we are getting close to setting a new record.
And yet, the economy remains buoyant, unwilling to fall into the much predicted and highly anticipated recession. Why? The number one reason is that both the consumer and the federal government keep spending like drunken sailors which has, to date, been propping up the economy. As you can see below, real GDP seems to have completely decoupled from the leading indicators. That said, I still think that GDP will turn negative sometime this year, possible Q2. Of course, as we saw in 2022, negative GDP apparently doesn't mean we are in a recession either, so who knows...maybe if we change the definitions enough, we could avoid ever having a recession again!
Durable Goods
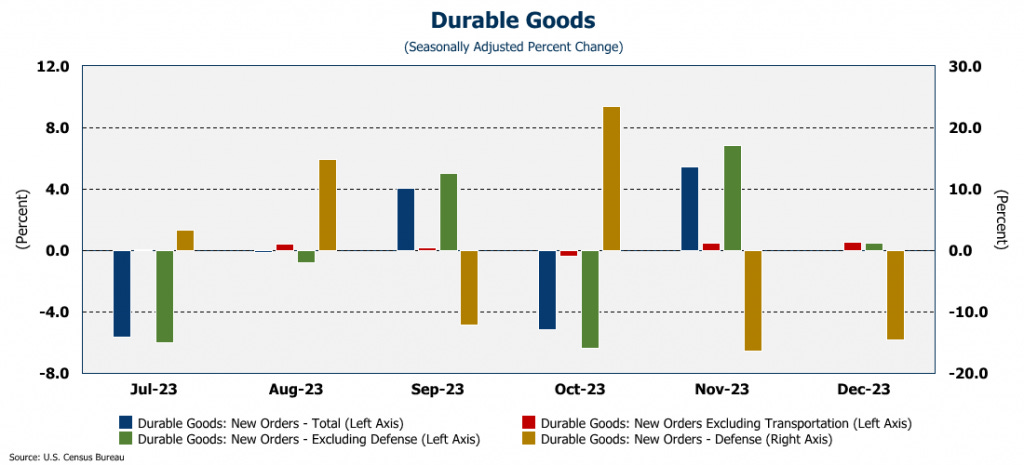
The December durable goods reading supports the data we presented last week that showed a clear slowdown in the manufacturing sector. Durable goods production in December was flat. Defense orders fell significantly for the second month in a row (Ukraine has run out of money to buy our weapons and congress seems hesitant to give them any more). Orders excluding defense rose 0.5%. Non-defense aircraft orders rose 0.4%, but with doors coming off Boeing's planes mid-flight, I don't think we will see those orders increase in the near future.
New Home Sales
New home sales rose 8% in December to a rate of 664,000. That was the largest month-over-month increase in 2023. At the same time the median cost of a new home dropped 3% in December to $413,200. That is nearly 14% lower than the median home price last December ($479,500).
Mortgage rates have dipped below 7% and stood at 6.69% this week. But as we mentioned last week, that isn't nearly low enough for existing home owners to give up their existing mortgage and put their house on the market. As such, new home sales have completely decoupled from existing home sales. The supply of new homes dropped slightly from 8.8 months to 8.2 months which should limit the further decline in prices as supply shrinks. Further support of this position is the fact that single-family starts dropped 4.3% in December, and single-family permits dropped 8.6% in the same month.
Personal Income and Spending
This morning we got data on personal consumption in December, and it confirmed what we already knew from the huge jump in revolving credit we got two weeks ago...the consumer spent like crazy in December! For the month spending was up 0.7%, far outpacing the 0.3% increase in income. Not surprisingly, the savings rate dropped to 3.7% from 4.1% in November, which was the lowest level in a year. Even adjusted for inflation, consumption was up 0.5% and incomes were up 0.1%. The big drivers of consumption were new cars, medicine, health care and financial services. Oh....and it appears we gambled a lot more as well.
PCE Inflation
The Personal Consumption Expenditure (PCE) gauge of inflation remained constant in December at 2.6%. The Core PCE (i.e., PCE less food and energy) dropped to 2.9% from 3.2% in November - the lowest rate since March 2021. This is the Fed's preferred measure of inflation and, while still above the 2% target, it seems to be moving in the right direction. PCE for services fell to 3.9%, the lowest it has been since June 2021.
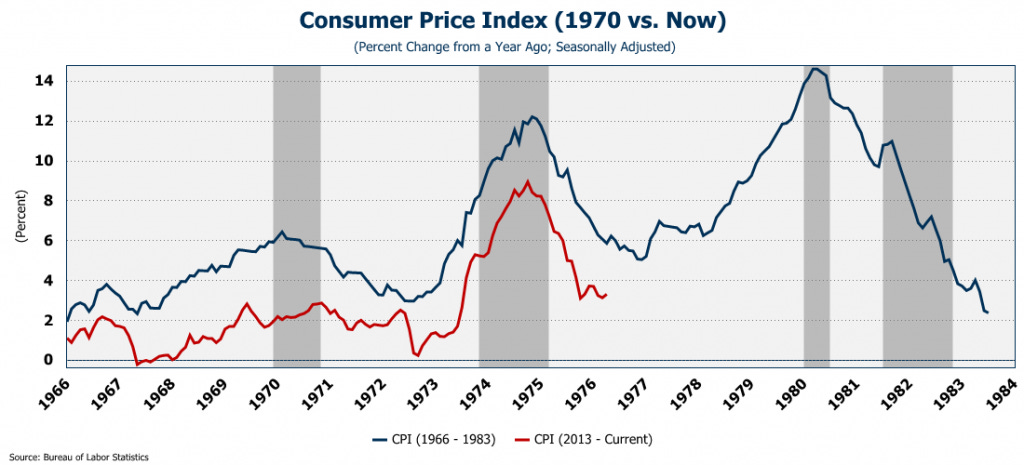
While all three PCE price gauges look promising, all three of them actually rose on a month-over-month basis. As I have stated before, inflation often comes in waves and there is still a lot of excess stimulus and money sloshing about in the system. A quick comparison of current inflation (as measured by CPI) to the inflation of the 1970's shows a disturbing similarity. Let's hope the Fed doesn't lower rates before the job is done or we could be in for another wave of inflation larger than the one we have just come through.
4th Quarter GDP (Preliminary Estimate)
Finally this week we got our first ("preliminary") look at how the U.S. economy performed in the fourth quarter of last year. The consensus expectation was for a slowdown to 2.0% annual growth from the 4.9% rate in the third quarter. The number came in at an astounding 3.3%...a slowdown from the third quarter, but much hotter than was expected. Given the extremely high level of consumer spending in both November and December (that I reported on last week and mentioned above) it isn't surprising that once again, the consumer kept the economy afloat, representing 1.9 points of the 3.3. The second largest contributor was...you guessed it...government spending accounting for another 0.6, So, of the 3.3, consumers and government represented 2.5.
Digging into the report we find this curious statement...."Within goods, the leading contributors to the increase were other nondurable goods (led by pharmaceutical products) as well as recreational goods and vehicles." It turns out that healthcare (specifically medicine) and RVs contributed roughly half of the growth in consumer spending in the fourth quarter! We filled our prescriptions and then hit the road for a winter holiday!
With respect to government spending, I know that above I mentioned a possible recession in Q2. However, the fact is that I have been calling for a recession for a while. Frankly, I didn't think that the consumer could keep up the pace of spending. Apparently, they can. But more importantly, it is government spending that may keep the economy afloat. The annual budget deficit for the U.S. is $1.5 trillion, and that is the projected deficit annually through 2030 (graph below).
Government over-spending at that level might just keep the economy afloat and out of recession. But as I pointed out two weeks ago, it comes at a cost, and the bill always comes due. It is projected that the federal debt service by 2030 could reach an astonishing $3 trillion per year. We just can't keep spending at this level. And, because of the debt service, there are diminishing returns. Nominal GDP grew $328.7 billion in the fourth quarter. But we did that by increasing the budget deficit by $509.9 billion over the same period...$1.55 in budget deficit to generate $1 in economic growth. Total federal debt grew $833.7 billion in the fourth quarter...or $2.54 in new debt to generate $1 in economic growth. Not a sustainable trend.
Finally, we are living in a strange time when Gross Domestic Product (GDP) is positive while Gross Domestic Income (GDI) is negative. GDP is the market value of all the final goods and services produced within a country’s borders. GDI is all of the money earned for all of the goods and services produced in the nation during a specific period. In theory, they should be nearly identical and rarely is GDP positive while GDI is negative. The last two times were in the early 2000's and 2007, and both times, the economy was in recession. Currently, the two measures are FAR apart...farther than they have ever been in the past (graph below).
There is some thought that GDI is actually a better estimate of where the economy stands. There is research done by Federal Reserve economist Jeremy Nalewalk that shows early estimates of GDI identified the "Great Recession" of 2007-09 better than GDP (as can be seen in the image above). The current discrepancy between GDP and GDI is curious and makes one wonder if future revisions to GDP will track closer to GDI and show that the economy was actually much worse off that initially thought at the end of 2023.


