Weekly Economic Update 1-5-24: Job Openings; Employment; ISM Manufacturing and Services Index
The views and opinions expressed in this post are solely those of the author and do not necessarily reflect the views of the Georgia Institute of Technology or the Georgia Board of Regents.
Happy New Year! I hope all of you had a wonderful Christmas and are off to a great start in this new year!
I ended the year with 88 subscribers to this weekly update. Slightly less than the 100 I was hoping for, but still more than I thought I would have when I started back in August. I don't turn on the "comments" section because I wouldn't have time to respond to all the comments/questions posted there, but several of you have sent me e-mails, texts, or commented on LinkedIn and have told me how much you enjoy the update. Thanks to all of you for your kind words. And a special thanks to Matt Forshee, Dan McRae, and Alan Durham who have vast followings on LinkedIn and have promoted and re-posted the update regularly. I hope the audience keeps growing and more people find this useful.
Having done this for 5 months, I have learned a little bit, and as I start a new year, I am going to make some minor changes. Primarily, I am not going to try to hit every single piece of economic data that comes out each week. I'll get to most of them, especially the big ones, but I think it is more important to focus on the more insightful data releases and spend more time on commentary and explanation of those, than try to hit every single thing that comes out.
Next, I am going to develop a "glossary" page that will have the explanations and definitions of each piece of economic data. That way I can simply provide a link to that page each week and not have to define each economic variable every month. I hope to have the completed soon.
And finally, I am going to add more color to the graphs. Although this economic update is not affiliated with Georgia Tech in any way, I have been trying to stick with Georgia Tech colors in the graphs since I also use them in my professional presentations. But frankly, navy, old gold, gray, and yellow just aren't giving me enough contrast and the graphs are not easy to read. (And apparently, some of you aren't really Georgia Tech fans, which I simply do not understand...)
Hopefully all these changes will make the weekly e-mail/post easier to read and comprehend. If you have any other suggestions, please feel free to let me know. Now, on to the data.....
Job Openings and Employment
Job openings for November dropped to 8.8 million, the lowest level in 32 months and further evidence that the labor market is cooling off as the long period of Federal Reserve interest rate hikes may finally be slowing the economy. Further evidence of a slowing labor market is the fact that the number of people quitting jobs dropped to a 33-month low of 3.5 million producing an overall "quit rate" of 2.2%. Excluding the pandemic, that is the lowest the quit rate has been since early 2018.
The first Friday of the month always brings us the employment data for the previous month. And today, we got some real insight into the what is happening in the labor market. This morning, the Bureau of Labor Statistics (BLS) reported the employment number for December - 216,000 new jobs added to the economy. As usual, the number will be heralded as a "strong" jobs report. But is it? As we do every month, we need to dig a little deeper into the numbers.
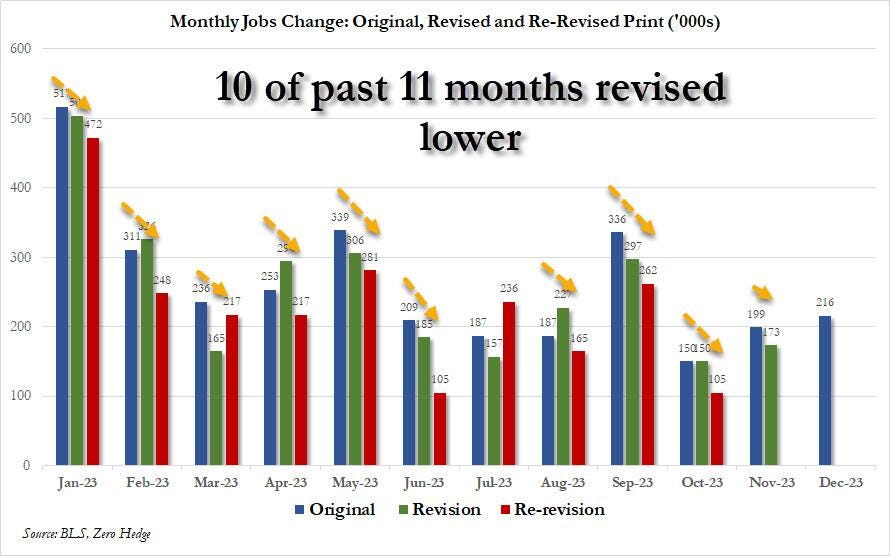
First, as has been the case for 10 of the last 11 months, the jobs number from the previous month was revised significantly lower. Over the past year, the initial number is ALWAYS an over-statement of reality. I have been following the monthly jobs report since my first job as an economist in 1991. The data always get revised. Sometimes it is up....sometimes it is down. That is the nature of survey data, seasonal adjustments, and statistical analysis. It is statistically impossible for the data to ALWAYS be reported high only to be revised down every month. And yet, that is what has happened nearly every month for a year.
I hate to be so politically cynical, but the only logical reason for this seems to be so the administration can take credit for a "strong jobs report" each month, while ignoring the revisions to prior months. This is why I like to show a three-month moving average graph that takes all previous revisions into account. As you can see below, on a three-month moving average basis, employment is clearly slowing. No doubt next month, we will learn that the December number was also overstated.
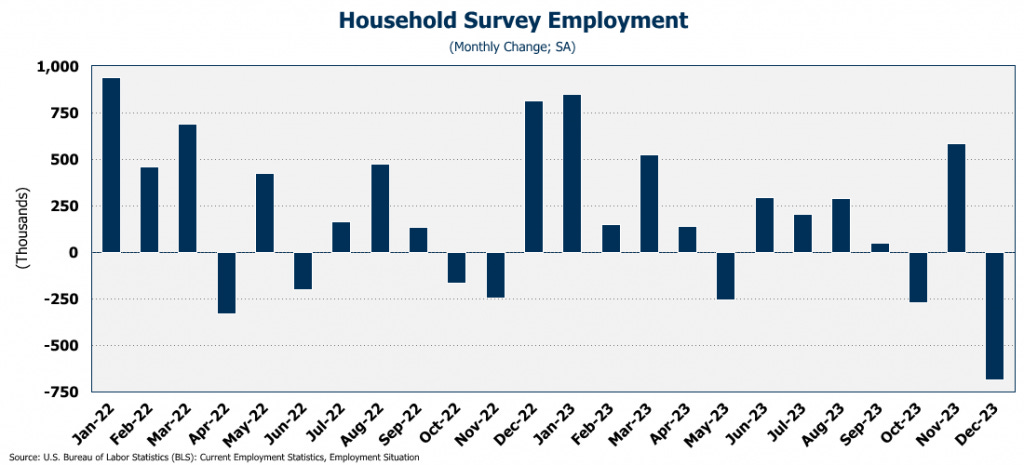
Second, while establishment payrolls showed 216,000 new jobs in December (until future revisions), the Household Survey showed that, in total, the number of people who report being employed DECLINED by 683,000!! That is the biggest monthly drop since we shut down the economy for COVID in early 2020!
The gap between what is being reported by the establishment survey and the household survey continues to widen as job growth is not in full-time employment, but in part-time jobs and those picking up a second or third job for economic reasons.
Which leads to my third point... a deeper dive into the household survey shows that what job growth there was in December was all in part-time jobs. The number of new part-time jobs jumped 762,000 in December to the highest number on record! At the same time, the number of people reporting to have full-time employment plunged 1.5 million!
Fourth, the number of people holding multiple jobs rose to the highest level ever at 8.7 million! At the same time, more than 675,000 people just dropped out of the labor force. Where did they go and what are they doing? By dropping out, they don't get included in the unemployment rate which remained at 3.7%. Easy to keep a low unemployment rate when you don't count people with part-time jobs (even if they want full-time work) and those who have just given up and dropped out of the labor force.
There can be no question that the December jobs report was an unmitigated disaster. There will be those who try to put lipstick on this pig and only focus on the 216,000 headline number, but by just about any measure, the labor market is not doing well and is headed in the wrong direction.
ISM Manufacturing & Services Index
The Institute for Supply Management (ISM) Manufacturing Index rose slightly to 47.4 in December. However, any number below 50 means that the manufacturing sector is declining and the index has been below 50 for 14 consecutive months. This manufacturing contraction is the longest since the 2000-01 recession just after the dot-com bubble collapsed.
As to the components of the index, the Employment Index did tick up slightly, but remains below 50. The New Orders Index dropped and while the Backlog or Orders Index improved, it is also still well below 50. In all, the manufacturing sector remains well in contraction territory.
The ISM Services Index, a gauge of conditions at service-oriented businesses, fell in December to a seven-month low. While still above 50, the decline suggests a slowing of the economy. The decline in the service sector was primarily due to a slowing in the rate of growth for new orders, and a contraction in the level of employment in service industries.
It is a short update this week as there wasn't a lot of economic data released. In summary, what we learned is that the labor market seems to be in rough shape as workers are losing full-time work, and taking multiple part-time jobs to make ends meet. The service-sector is slowing, while the manufacturing sector continues a year-long contraction. Not really the best start to the new year.


