
Weekly Economic Update 10-18-24: Federal Reserve Balance Sheet; Consumer Sentiment; Retail Sales; Industrial Production; Home Builder Confidence; Building Permits; and Housing Starts
Consumers Are Feeling Less Confident and Spending Less Money as the Election Approaches
The views and opinions expressed in this post are solely those of the author and do not necessarily reflect the views of the Georgia Institute of Technology or the Georgia Board of Regents.
I mentioned last week that I wouldn’t be surprised to see a return to quantitative easing. For new readers who may not know what I was talking about, I want to explain further.
You can see from the graph below how the Fed has used their balance sheet as a policy tool. The first three green lines represent QE1, QE2, and QE3 that they embarked on after the 2007-08 financial crisis. (“QE” stands for “quantitative easing.”) In 2018 they began their initial attempt to roll back that stimulus. But in March of 2020, COVID hit, and over a period of 4 weeks they used the balance sheet to absorb $1.5 trillion of securities, providing the government cash for their initial COVID response, the CARES Act, and and the Paycheck Protection Program (PPP).
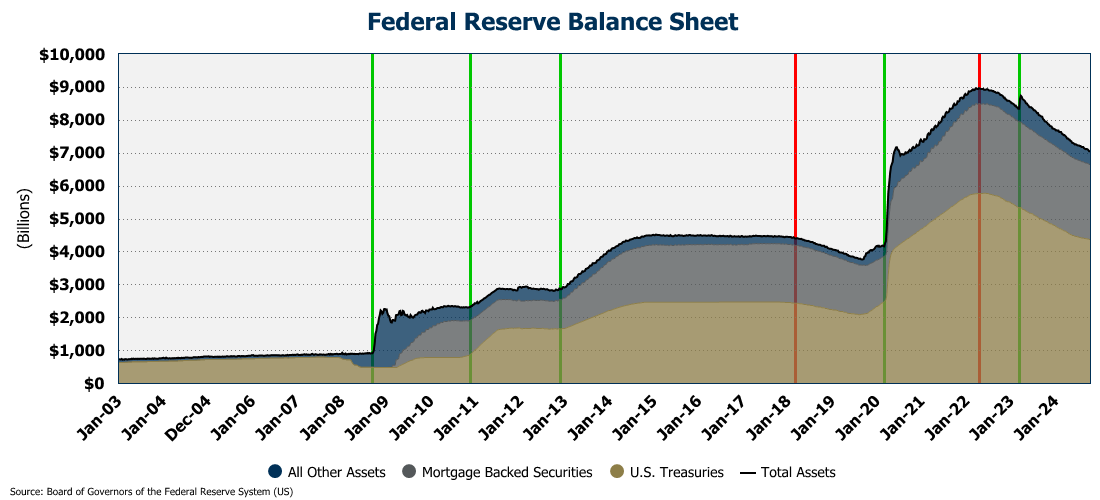
Over the next two years, they purchased another $2 trillion of debt to provide the funds for the American Rescue Plan, and direct payments to the citizenry (assuming you qualified). The balance sheet peaked at a hair below $9 trillion in April of 2022.
However, since then, the Fed has slowly been shrinking their balance sheet. (With the exception of the blip in March 2023 to deal with the failure of Silicon Valley Bank.) In fact, since the peak, the balance sheet has fallen nearly $2 trillion…more than a 20% drop and back to the level of May 2020.
That action is deflationary, and is nice to see. But it is the ONLY deflationary policy move in which the Fed is currently engaged. Everything else they are doing is counter to their policy goal of stable prices.
And that is why I said that, despite Fed Chair Powell’s statements to the contrary, I believe another wave of QE is right around the corner. You can already see that the rate of decline in the balance sheet is tapering off. With deficits of $2.5 trillion or more forecast for as far as the eye can see (regardless of who wins the White House) I can’t imagine that the Fed won’t become a buyer of Treasuries in the near future.
Consumer Sentiment
The University of Michigan released their preliminary gauge of consumer sentiment for October and it dropped down to 68.9 from 70.1 in September (full release here). Wall Street was expecting a reading of 71.
Consumer sentiment fell not only for present conditions, but for expectorations as well. This is similar to what we saw a few weeks ago with the Conference Board’s Consumer Confidence readings. With the election looming, I don’t expect these numbers to change much until we get some clarity about who will be the next President.

The biggest complaint in the survey continues to be high prices. And in fact, it may be starting to dawn on consumers that prices won’t be coming down soon. According to the report, consumers’ expectations for overall inflation over the next 12 months rose to 2.9%. The index has been below 3% since July but it is creeping back up. Expectations for inflation over the next five years came in at 3%.
Retail Sales
For the month, retail sales came in relatively strong in September growing 0.4%. However, on a year-over-year basis, retail sales growth slowed to only 1.7% year-over-year (full release here). Because that is lower than the current rate of inflation, it means that consumers actually bought far less than they did one year ago. In fact, for eight of the nine months so far this year, inflation-adjusted retail sales have been negative.

Digging into the report, we see that, on an annual basis, electronics & appliance stores were down 4.6%; sporting goods, hobby, and book stores were down 3.5%; furniture and home furnishings were down 2.3%; and motor vehicle and parts were down 0.3%. Sectors that saw increases included health and personal care (4.6%); clothing stores (3.5%); and grocery stores (2.5%).
But here is what is interesting. You probably know that retail sales data have to be adjusted for seasonality. For example, obviously retail sales tend to rise during Christmas (December), and then decline sharply in January. It happens every year. So, we use “seasonally adjusted” data throughout the year to help smooth out those ups and downs in an attempt to see what is really going on with the consumer.
If you look at the non-adjusted retail sales number, it plunged in September by $49 billion! That is enormous! If you go back in history, there has never been a single non-January month, where retail sales dropped off that much - with one exception….April 2020 when the economy shut down for COVID. Other than that, this is the single worst non-January monthly decline we have in the data. In order to get the “official” seasonally adjusted number up to a “strong” monthly rate of 0.4%, they added $32 billion to the September’s number…the largest seasonal adjustment ever for the month of September.
So, “adjusted” September was strong. But if you look at what was actually spent, it was a disaster. Is the consumer starting to realize that they are in trouble? Or are they just taking a pause before blowing out the credit cards for Christmas! Last year I voted for the former. But I’m done betting against the U.S. consumer’s ability to spend. Time will tell.
Industrial Production & Capacity Utilization
The aircraft machinists strike at Boeing, and a couple of rough hurricanes all came together to significantly dampen industrial production in September (full release here). On an annual basis, total production was down 0.6%. Total manufacturing was down 0.4%, and manufacturing ex. auto was down 0.5% year-over-year as the production of motor vehicles and parts dropped 1.5% in September alone.

Capacity utilization (a measure of the extent to which the nation’s potential output is being realized) fell to 77.5. Manufacturing capacity utilization fell to 76.6. Both have been steadily declining since early 2022 - consistent with the overall contraction of the manufacturing sector that we have seen demonstrated by several different data sources.

Home Builder Confidence
Well, the Fed cut rates last month…but someone forgot to tell the bond market because since then, the 10-year treasury has moved above 4%, and mortgage rates have moved higher! (Funny…turns out treasury and mortgage rates are determined by the market…not a bunch of Federal Reserve Bank Presidents with degrees in Engineering….) Even so, home builders remain every optimistic about the future! Builder confidence rose in October, no doubt because they do expect mortgage rates to fall in the coming months (full release here).
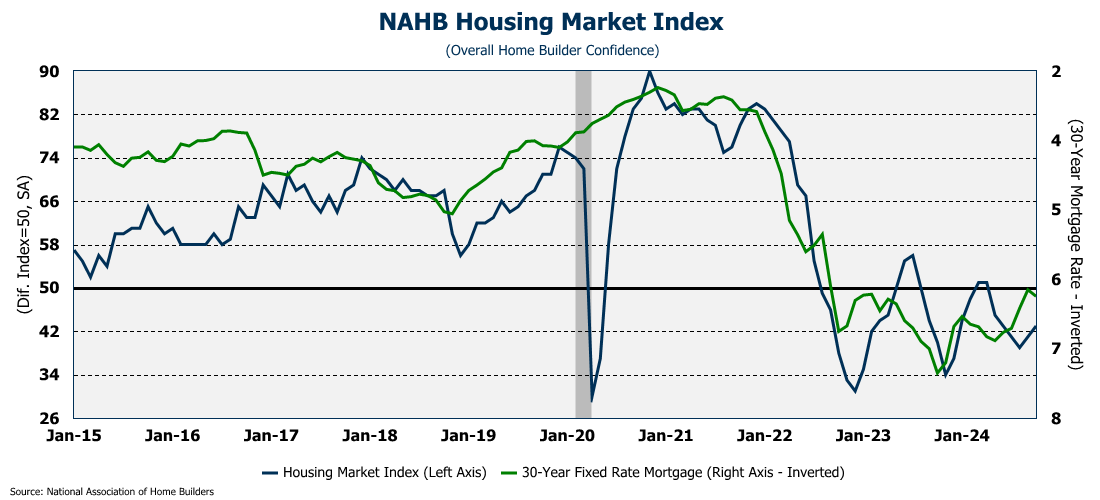
Digging further into the data we see exactly that. The index for their “outlook over the next 6 months” rose to 57…it’s highest level since April. Surprisingly, “traffic of prospective buyers” also rose in October, but is still well below 50. As a reminder, this is a diffusion index where any number over 50 indicates that more builders view conditions as good than poor. Therefore, even though traffic improved, more builders saw overall traffic as “poor” than “good.” The same holds true for “single-family sales” - it improved in the month, but was still below 50.

Finally, the number of builders cutting prices held steady at 32% in October and the average price reduction was 6%, which is the long-term trend. The use of sales incentives rose slightly to 62% in October.
Building Permits & Housing Starts
Finally, this morning, we got building permits and housing starts (full release here). Last month, it seemed the exuberance of the home builders was reflected in their requests for building permits and their activity starting homes. However, both of those pulled back significantly in September. Building permits declined 2.9% (far more than expected) in September, but again, those were coming off a strong August. The decline was driven by a drop of 8.9% in multi-family permits. Permits for multi-family with 5+ units fell even further at 10.8%. By contrast, single-family permits were actually up slightly by 0.3% for the month.
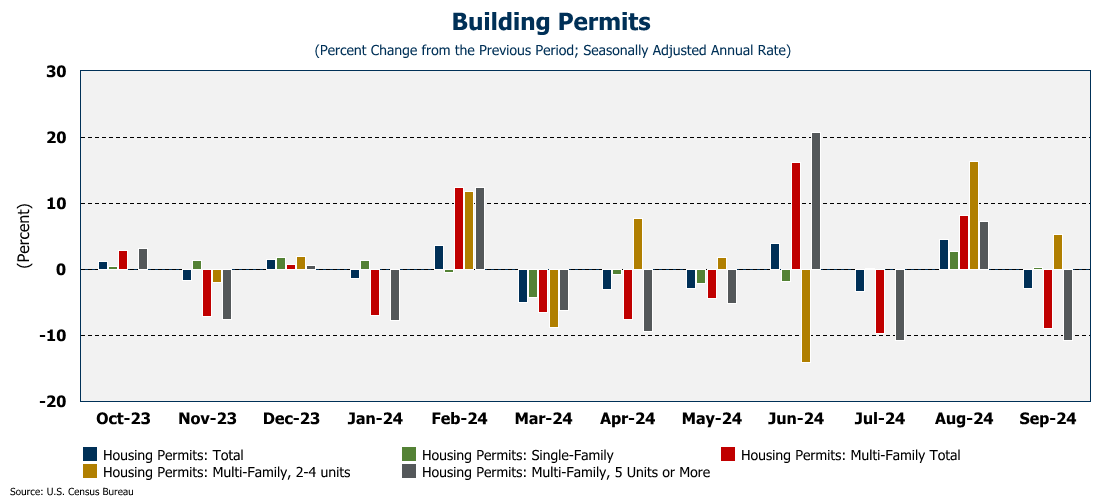
With respect to housing starts, they were down 0.5% in September. But again, they were were also coming off a strong August. And, once again, multi-family pulled down the overall number, dropping 9.4% - the second consecutive monthly decline. Single-family starts were actually up slightly at 2.7% - the second consecutive monthly increase. So, for the past two months, single-family starts and multi-family starts have been moving in the opposite direction.

With mortgage rates not responding to the recent Fed cut, it remains to be seen if home builders will remain optimistic and keep building single-family homes.
One More Thing…
I want to thank Tommy Jennings and Heaven & Alvarez CPAs for their support this week. And I especially want to thank my friend Dave Gmeiner who signed up to became my first “member”! If you enjoy this update and want to keep it going, please click or scan the link below and become a member!

Finally, I will be out of commission all next week handling some personal issues and it is very possible that for the first time in 14 months that I will miss an update. There isn’t a lot being released next week, so if I fail to publish, you won’t be missing much.
But then again, if I can get to a computer….we’ll see what happens.