Weekly Economic Update 11-01-24: Consumer Confidence; Personal Income & Spending; PCE Inflation; JOLTS; October Employment; and Third Quarter GDP
Consumers are confident, eager to spend, but the labor market is getting tight
The views and opinions expressed in this post are solely those of the author and do not necessarily reflect the views of the Georgia Institute of Technology or the Georgia Board of Regents.
After a few light weeks in the economic data department, this week brought us a lot of data. To keep this post at a reasonable length, I am going to leave a few pieces of data out and focus on the more meaningful releases.
Consumer Confidence
Consumer confidence surged in October, far above what experts were expecting (full release here). If consumers are concerned about the upcoming election, they don’t seem to be showing it. Confidence in the present situation jumped 14 points - the biggest one-month increase since May 2021. The index for expectations about the economy 6-12 months from now also increased, but not as much as it did for the present. And when asked about a recession over the next 12 months, the share of respondents anticipating a recession fell to its lowest level since the question was first asked in July 2022.
In short, the month before the election, it appears people are feeling good, although overall, confidence is well below pre-COVID levels. The question is, are they feeling good because of the current economy or because of who they think is about to win the election? If we knew the answer to that, we would probably already know who will come out on top next Tuesday.
Personal Income & Spending
Total personal income rose 0.3% in September, which was expected. What was NOT expected was that personal consumption jumped 0.5% (full release here).
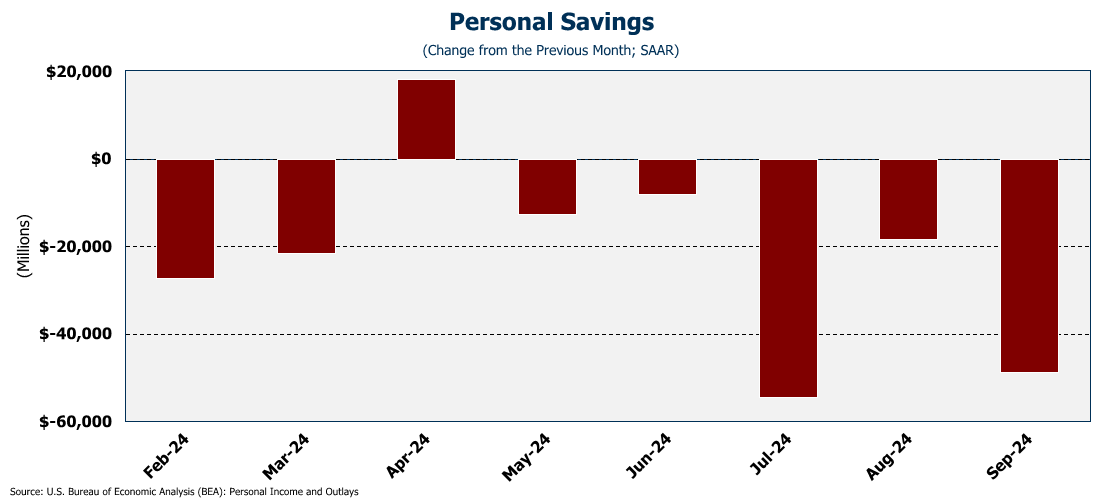
As we saw above, consumers are feeling confident and they went out and spent like crazy in September. That wouldn’t be so bad if wages were keeping up. But they are not. So how do consumers keep spending? Drain savings and increase debt. For seven of the last eight months, households have drained their savings - more than $170 billion since January. Over the same period, they have increase their revolving debt by $30 billion. How long can this continue? I’ve given up trying to guess.
One last comment about income growth……the extent to which government transfer payments constitute income has grown sharply over this year, and now stands at more than $4.4 trillion. If I was cynical, I might think that the growth was related to it being an election year.
PCE Inflation
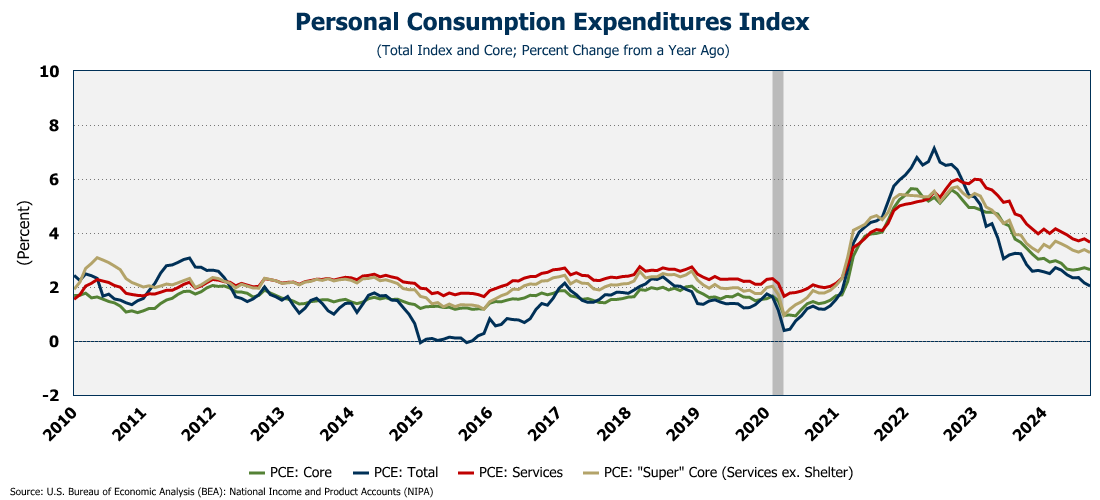
This week got the latest read on the Fed’s favorite measure of inflation - and the last one we will get before their next meeting (full release here). The headline number came in at 2.1%….just barely above the Fed’s 2% target rate. Sounds good right?
It is good. Certainly better than the alternative. However, core PCE has been stuck at 2.7% for several months, and doesn’t seem to want to come down. In other words, take out the cyclical items in the inflation measure, and overall prices are stuck at the 2.7% level. Similarly, service PCE is still running hot at 3.7% and, while very slowly coming down, it hasn’t really moved appreciably since June. The same holds true for “super core” PCE inflation.
But here is the real concern….those numbers are all compared to where PCE was one year ago. On a month-over-month basis, the number actually came in hotter than expected. On an annualized basis, all three of the main measures of PCE inflation are accelerating from last month. So while year-over-year is down, the annualized from last month is actually moving up. That is NOT what the Fed wants to see heading into their November meeting.
Job Openings and Labor Turnover Survey (JOLTS)
On Tuesday, we got the latest JOLTS report which showed that the labor market is clearly tightening (full release here). The “quit rate” has fallen to 1.9%, the lowest it has been since July of 2015 (with the exception of the COVID crash.)
The reason the quit rate is dropping is because the number of available jobs continues to decline. In September, the number of job openings fell to 7.4 million. That is still higher than pre-COVID levels, and still slightly higher than the “official” number of unemployed. But that gap has closed significantly, and the number of unemployed is poised to surpass the number of available jobs.
This data suggests that the labor market is clearly tightening. Over the past year or so, government and health care have been the major drivers of employment growth representing 60% of all new jobs. Looking at industry level data, we see job openings dropping off significantly in both of these sectors. As growth slows in these two sectors, overall employment growth will slow significantly.
Finally, as I have pointed out in the past, the number of job openings in construction continue to diverge from the “official” level of employment reported for the construction sector. Thanks to high interest rates, the housing market has effectively stalled. If that doesn’t change, I suspect that employment in construction is about to fall off a cliff.
October Employment
12,000 jobs. That’s it. That is all the entire U.S. economy could create in the month of October. That is the worst jobs number in three years (full release here).
Of course, there was a major strike at Boeing, and a couple of hurricanes that certainly didn’t help the situation. And that is how a lot of media will explain this report away. And those excuses are indeed legitimate. But then, how do you explain the 112,000 negative revision to the numbers for August & September? You can’t. (Seven of the past nine months have been revised lower than originally reported.) The fact of the matter is that the trend is clear. The labor market is tight. You could see it above in the JOLTS numbers and today’s employment report confirms it.
By the way, the government added 40K jobs in October, so, in fact, private sector payrolls were negative for the month. That is the first time private payroll jobs have been negative since late 2020.
And you can see it as well in the household survey where total part-time jobs fell 227K and total full-time jobs fell 164K! In addition, the number of “permanent jobs losers” moved up to 1.8 million in October.
Third Quarter Gross Domestic Product (GDP)
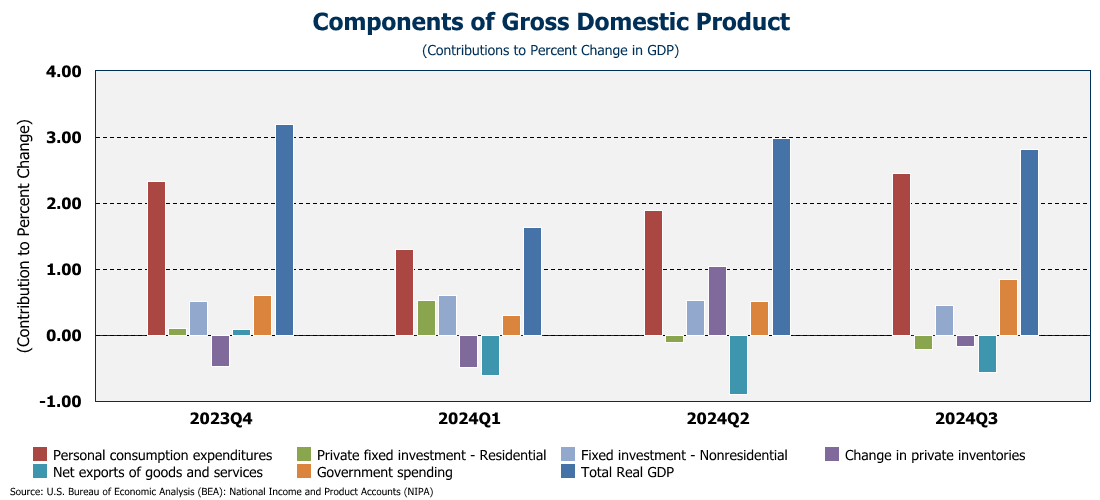
But don’t worry about any of that because the economy grew at 2.8% in the third quarter, driven by a HUGE surge in personal consumption! No jobs? No problem! The U.S. consumer will save us all - as we saw in the September data above! Consumer spending grew at 3.7% in the third quarter, and represented 2.5% of the 2.8% growth - 87% ! Government spending represented another 30% of the growth. (When the government is running a deficit that is 6% of GDP, you aren’t likely to have a recession!) Those two categories combined represented 117% of third quarter growth! Net exports, change in inventories, and (to no one’s surprise) residential fixed investment were all negative in the quarter (full release here).
So what did we buy? Purchases of both goods and services were up in the quarter. With respect to goods, the leading categories included “other nondurable goods”, led by prescription drugs. (I guess just about everyone now is on Ozempic!) As for services…the leading categories included health care, led by outpatient services. So more drugs and outpatient services. That is where the spending growth occurred. That’s just great. Not to get political, but maybe “Making America Healthy Again” isn’t such a bad idea.
Finally, digging deep in the report, we see that core PCE inflation for the quarter came in at only 2.2%. While that is good, it was hotter than the 2.1% that was expected. The GDP growth of 2.8% was slower than the 3.0% that was expected. So, slower growth, and higher inflation, fewer jobs, and consumers going crazy on drugs and healthcare.
I don’t care who wins next week….they are going to have a real mess on their hands.
One More Thing…
Forget all the data….you know the economy is bad because for the first time since this started, no one bought any coffees last week! But, we did get a new Bronze member - Brad Wood. Thanks to Brad and my other members for supporting this effort. I liked Brad’s comment….
If you want to make a contribution or become a member, just click/scan the QR code below. Thanks to everyone who helps keep this update going each week.
And please share the update with your all your networks. One year ago this week, I only had 54 subscribers. Now, there are nearly 450 and roughly 1,000 views each week. Let’s get 500 subscribers by the end of the year!
Thanks again for all the support! And don’t forget to vote!!


