

Weekly Economic Update 11-07-25 Shutdown Edition #6: ISM Manufacturing & Services Indices; and ADP Employment
Oh SNAP!!
The views and opinions expressed in this post are solely those of the author and do not necessarily reflect the views of the Georgia Institute of Technology or the Georgia Board of Regents.
And the shutdown continues…
This would normally be the week we would get employment data for October from the Bureau of Labor Statistics (BLS). But alas, it is not to be. Like an addict in rehab, I am starting to have major withdrawal due to a lack of economic data. As is too often the case, you don’t realize how much you appreciate something until it is gone.
Speaking of something that is gone, there was a lot of talk this week about the Supplemental Nutrition Assistance Program (SNAP), which provides monthly funds to help low-income individuals and families buy groceries. Due to the government shutdown, those funds did not go out on November 1. However, thanks to the limited contingency funds and the actions of a few district courts, about half of the benefits were paid later in the week. Naturally, however, the whole issue created quite a stir.
So, given all the media attention, I thought I would dig into the data. According to the U.S. Department of Agriculture (USDA), nearly 23 million households receive some level of monthly SNAP assistance. According to the Census Bureau, there are about 133 million households in the United States. That means, 17.3% of all households in the country (or slightly more than 1 out of every 6) receive SNAP benefits.
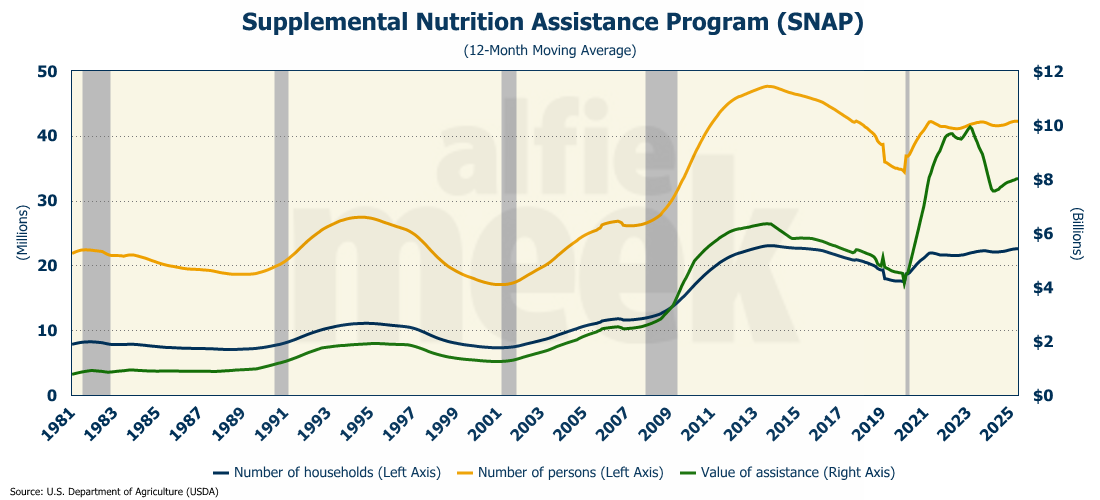
There are several interesting observations in the graph above. First, notice that after the 2007 financial crisis, the number of households on SNAP doubled. Now obviously, we don’t call it the “Great Recession” for nothing. Job losses were particularly severe, with unemployment peaking near 10%. Further, the slow recovery extended the period of need for many families. Research indicates that these economic conditions accounted for 50% to 90% of the caseload growth between 2007 and 2011, with effects lagging up to two years after economic changes.
But why did it stay at that level? Oh, it came off the peak of 23 million households in 2013, down to 18 million just before COVID, but that isn’t even close to the 11 million households that received SNAP prior to the Great Recession. Why did the numbers stay so high?
Turns out, we changed the rules. The three-month time limit for able-bodied adults without dependents (ABAWDs) was suspended. In addition, we effectively eliminated asset tests. And many states introduced online applications, phone interviews, call centers, data-sharing systems, and simplified application procedures. All of this resulted in participation rates among eligible individuals climbing from 69% in 2007 to 85% by 2013. And there they stayed.
Second, something significant again happened to the program post-COVID. In January 2020, SNAP benefits averaged $4 billion per month. Now we are over $8 billion monthly, and we were running close to $10 billion in 2023. It turns out that in response to the pandemic, federal legislation authorized the expansion of SNAP benefits through several measures, including broadening eligibility to include more students and unemployed adults, as well as “temporary” emergency allotments that provided additional monthly benefits to all SNAP households. These emergency allotments lasted until February 2023. As you can see in the graph above, when those expired, the monthly average expenditure dropped by about $2 billion.
In addition to expanded benefits, the application process was once again streamlined, and overall participation in the program increased again, reversing the pre-COVID downward trend.
Call me crazy, but shouldn’t we want the number of people on food assistance to slowly be declining over time? I mean, I would think so…unless, of course, the goal is less nutrition assistance and more an attempt to create a permanently dependent class of citizens…
ISM Manufacturing
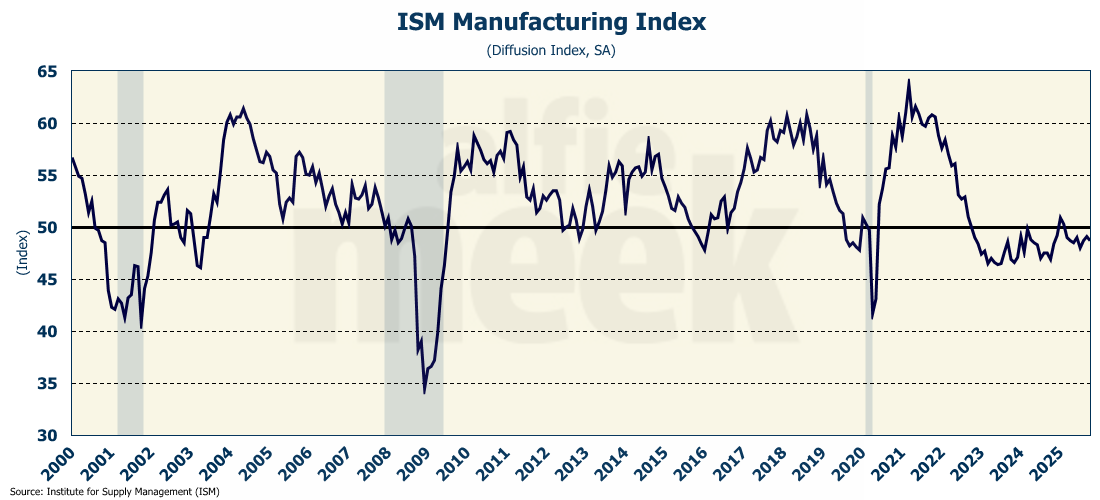
With the shutdown in full swing, the only data we are getting is from private organizations, and most of it is survey data. Not a great way to measure the health of the economy, but it is all we have. Toward that end, the Institute for Supply Management (ISM) released its manufacturing index for October, which missed expectations, falling to 48.7 (vs. 49.5 expected). This is the eighth straight month below 50, meaning the manufacturing sector is in contraction and has been for most of the year (full release here).
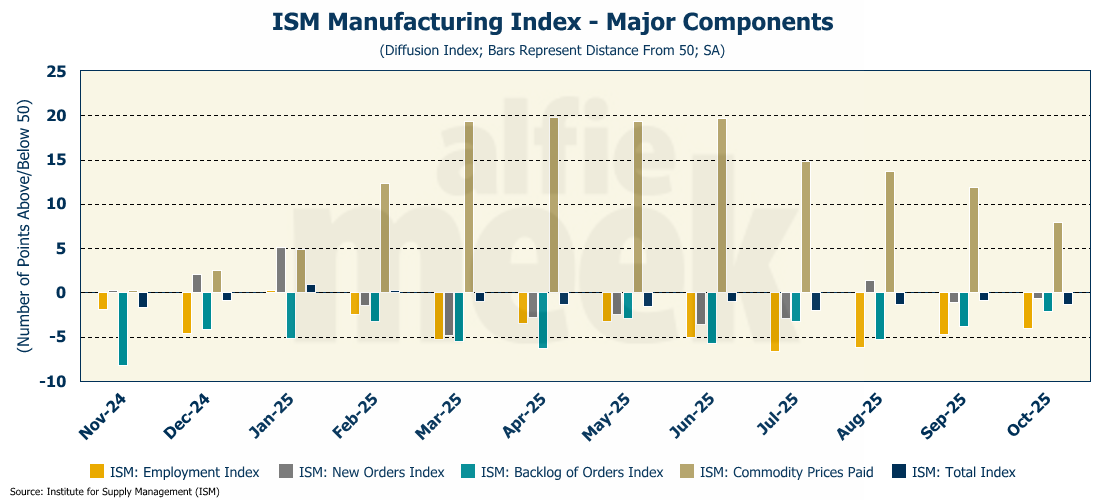
Looking deeper, we see that for the second consecutive month, all the sub-indices (except prices paid) were also below 50. However, even though they were below 50, several of them improved slightly. The employment subindex improved slightly, but is still below 50, where it has been since January, indicating a contraction in sector employment.
The prices paid index is above 50, but as you can see, it has been trending down since the announcement of tariffs in April, and has fallen for four consecutive months. In other words, purchasing managers see rising prices, but those prices are rising at a decreasing rate.
ISM Services
While the ISM manufacturing index was down, the services index rose in October to 52.4 (full release here). Only once this year has the index fallen below 50 as the service sector continues to expand.
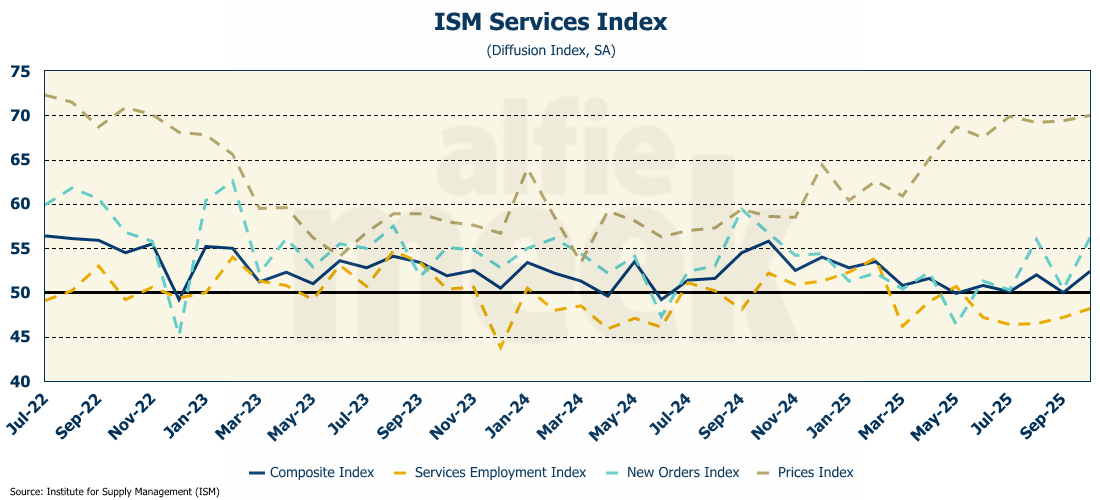
But again, the devil is in the details. New orders are up, but service sector employment is still below 50 and has been for much of the year. So while the sector may be technically expanding, it is doing so without increasing employment.
Also, unlike the manufacturing sector, the prices paid index for services is increasing and is now at its highest level since the peak inflation of 2022. In other words, purchasing managers are seeing prices rise at an increasing rate. Service inflation is more significant than manufacturing inflation because the bulk of consumer purchases are services.
ADP Employment
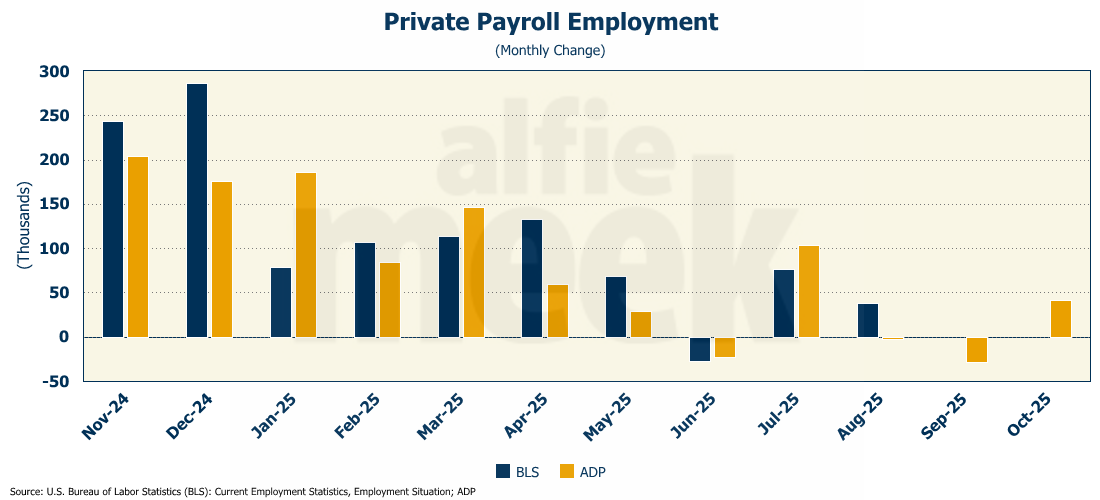
For the second consecutive month, we are without the ever-popular (albeit often revised and therefore virtually worthless) employment data from the BLS. This leaves us with only the ADP private employment report, which showed a surprising and quite unexpected increase in employment in October of 42K jobs (full release here).
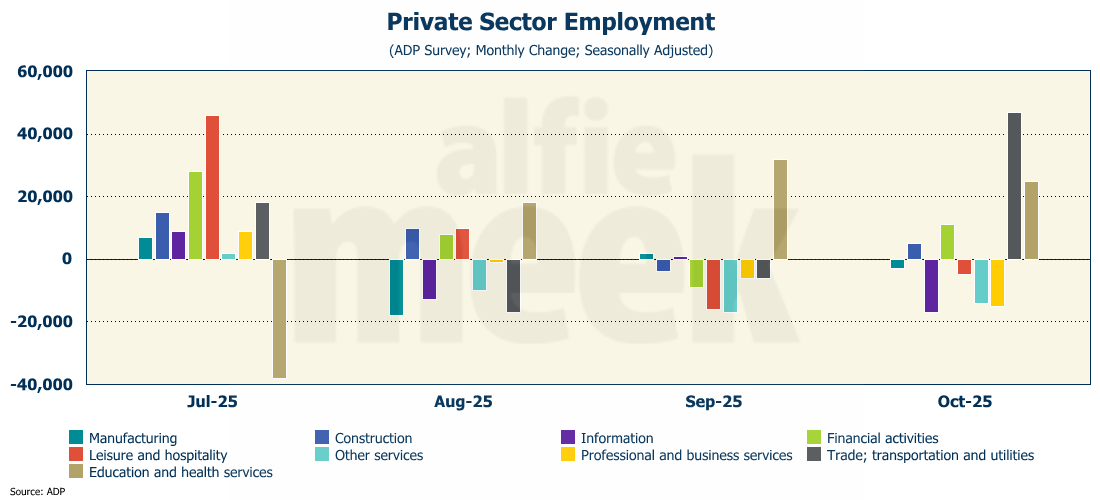
Consistent with the ISM manufacturing and services data above, manufacturing and several service sectors, including professional business services, information, leisure & hospitality, and “other” services, posted job losses. In fact, virtually all the employment gains for the month were in trade, transportation & utilities, as well as education and health services.
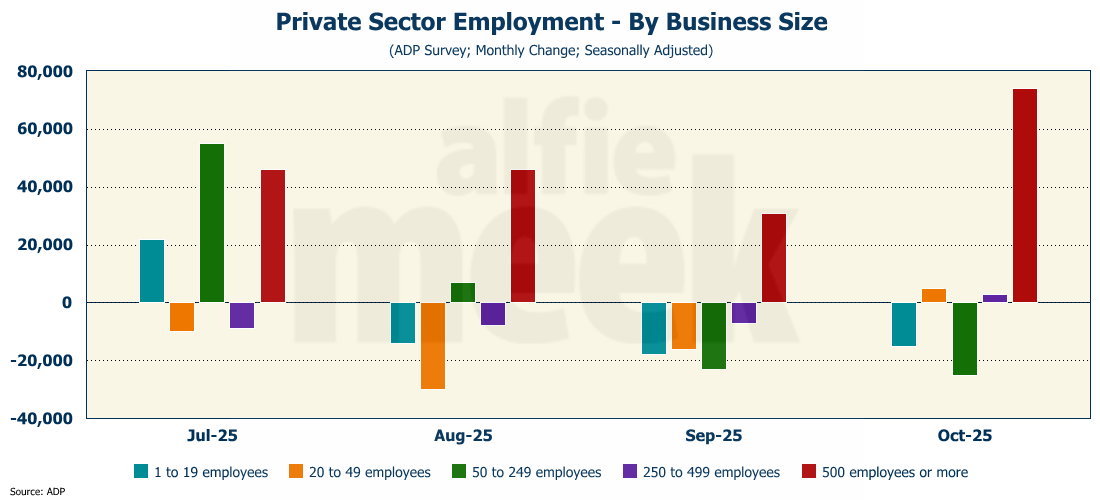
ADP also provides data by company size, and nearly all the growth in October was in businesses with more than 500 employees. In fact, that has been the case for the past three months; only in August and September, the job losses among smaller firms more than offset the large firm growth. This was not the case in October, which lead to stronger than expected private sector job growth for the month.
One More Thing…
On the first post of the month, I like to recognize my gold and silver members. Special thanks to my two “gold” level members, Andrew Hajduk and Beth Truelove, with the White County Chamber of Commerce, and my three “silver” level members, Dan McRae, Chuck Fitch, and Greg Whitlock. Their support helps cover the costs associated with putting this together each week. I hope to reach out to each of you individually this week to discuss how to transition your support over to the SubStack platform starting January 1.
If you do not yet have a paid subscription but would like to support this effort, please make a pledge on the SubStack app. If you would like to simply offer one-time support, you can still do that by clicking/scanning the QR code below.

The Weekly Economic Update is sponsored this week by:
