

Weekly Economic Update 11-17-23: Consumer Prices; Producer Prices; Retail Sales; Industrial Production; Home Builder Confidence; and Housing Starts
The views and opinions expressed in this post are solely those of the author and do not necessarily reflect the views of the Georgia Institute of Technology or the Georgia Board of Regents.
What a week! There was a LOT of economic data released this week and I was so busy, I have barely had time to digest it all! Let's get right to it...
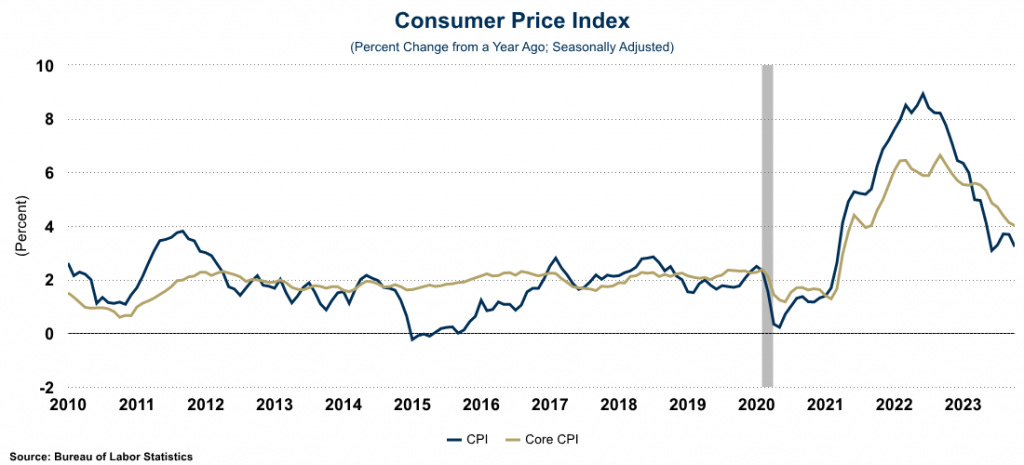
Consumer Price Index
The week started with the release of the consumer price index (CPI) which was unchanged in October. At that level, it is running 3.2% above October 2022. That was down slightly from the 3.7% annual increase posted in September. However, that was due to the fact that the price of oil/gas was down significantly in the month. If you remove food and energy (i.e., look at "core" inflation) the index is still running higher than 4.0% which is twice the rate the Fed wants.
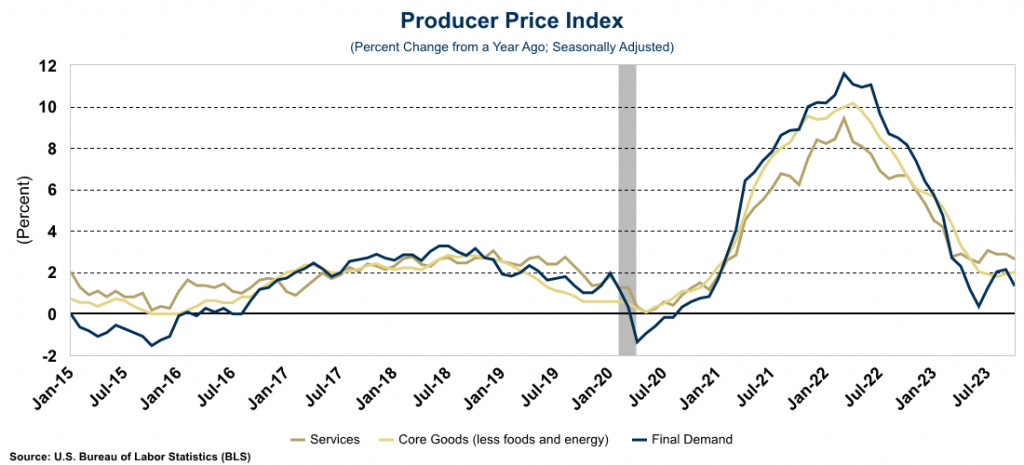
Producer Price Index
Conversely, producer prices fell 0.5% in October which is a sharp reversal from the 0.4% increase last month, and significantly weaker than the 0.1% increase that was expected. The October drop was the largest decrease since the beginning of the COVID-19 pandemic and puts the PPI at only 1.3% on a year-over-year basis. Even so, core PPI did tick up in the month and is running at 2.0%.
Other Thoughts on Inflation...
The inflation numbers seem to be coming down, and as such, several economists came out this week and said that this "keeps the Fed on course for rate cuts in 2024." Possibly. With inflation 2x the target level, we would need to see significant improvement in inflation for the Fed to consider rate cuts. Is that likely to happen? Maybe....
In my public presentations on the subject, I always start with Milton Freidman's famous quote that "inflation is always and everywhere a monetary phenomenon. It is made by, or stopped by, the central bank." I also like to point out that growth in the money supply takes about 18-24 months to show up in the inflations numbers. The graph below shows that the time lag is more like 16 months. Notice the trend...
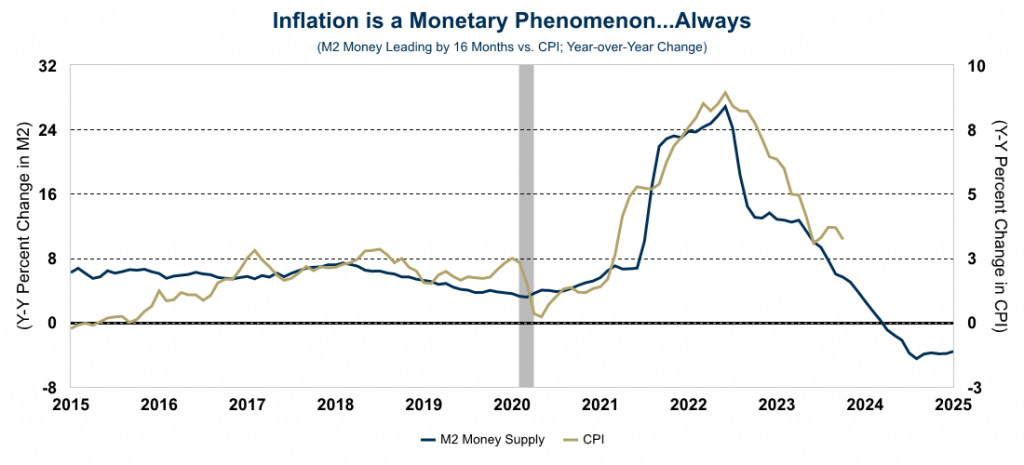
Last week I discussed the Fed's recent success in reducing their balance sheet. If they are able to continue on that path and also continue to shrink the money supply, that will have some interesting implications for inflation. In fact, based on the graph above, it starts to look like a move to DEFLATION. Can this trend continue? I don't think so. And here is why. Over the next year, the U.S. Treasury has $8 trillion in debt maturing and that will have to be rolled over at higher interest rates. In addition, as we also mentioned last week, they need to issue another $1.5 trillion in new debt. There simply are not enough buyers to absorb all that debt. The Fed will have no choice but to step in, and when they do, the balance sheet will explode, new money will be created, and inflation goes to the moon.
Politicians like to say that we will never default on our debt. Well, printing trillions of dollars and grossly devaluing the currency is a default...just by other means.
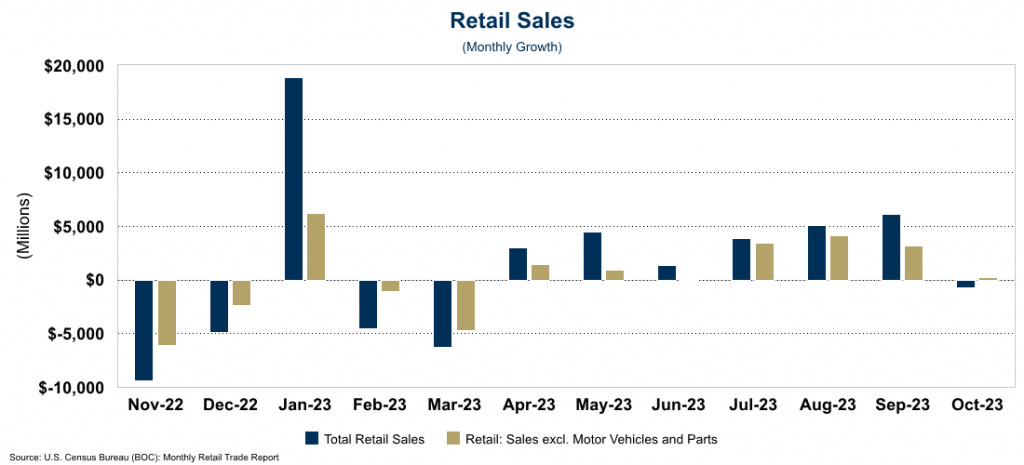
Retail Sales
Might we finally be seeing an end to the ever-resilient consumer? In October, retail sales dropped for the first time in seven months. Sales at gas stations were down, as oil prices are pulling back, and sales at auto dealers also dropped as the UAW strike brought fewer cars to the market. In addition, higher borrowing costs and the previously discussed inflation continue to put the squeeze on household budgets. And all throughout the week, several major retailers warned about the upcoming holiday season. Adjusted for auto sales, retail sales posted a very small increase. But clearly, retail spending is weak heading into the holiday season.
Industrial Production
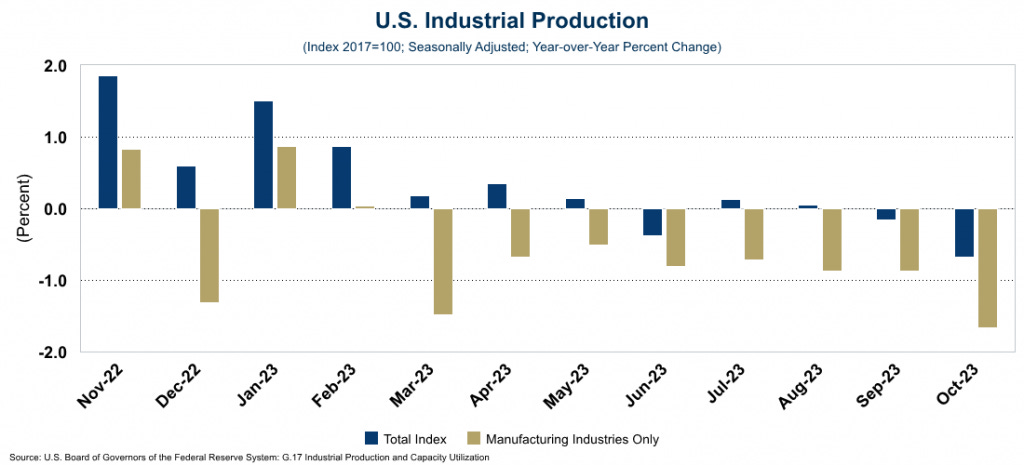
Industrial production in October dropped 0.7% from the same period a year ago, and manufacturing output dropped on an annual basis for the 8th month in a row. The decline in manufacturing production was the largest of the year, but not surprising due to the UAW strike, which is exactly what we expected to happen when we reported on this last month. Looking forward, higher borrowing costs and weaker consumer demand for manufactured goods will continue to dampen manufacturing as the end of the year approaches.
Home Builder Confidence & Housing Starts
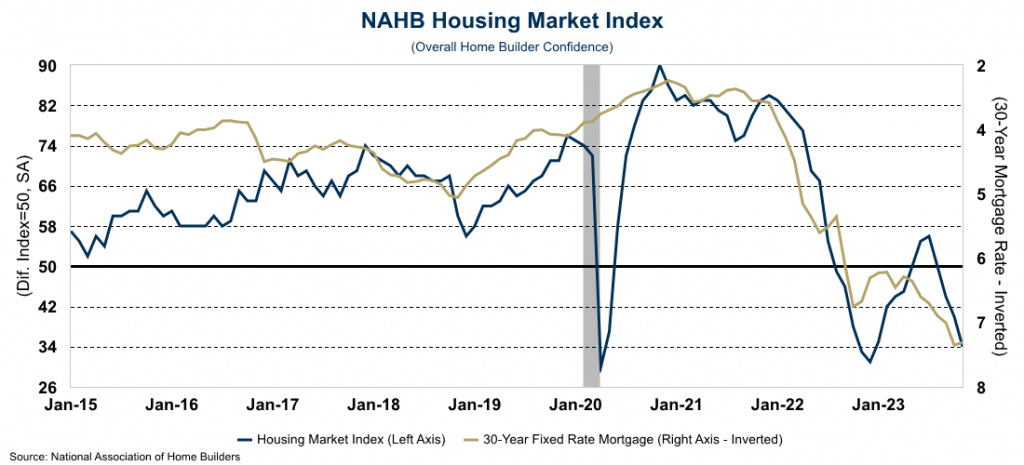
The National Association of Home Builders (NAHB) sentiment index dropped to its lowest level for the year in November. All three major component fell as builders were pessimistic about current sales; were negative about future sales; and reported a drop in traffic of prospective buyers. The index continues to inversely track right along with the 30-year mortgage rate which is hovering at 7.6% so far this month.
In addition, the share of builders cutting home prices rose to the highest level since late 2022 with the average price cut coming in at 6%. In recent months builders have been offering more generous mortgage rate buy-downs, but those are starting to come to an end.
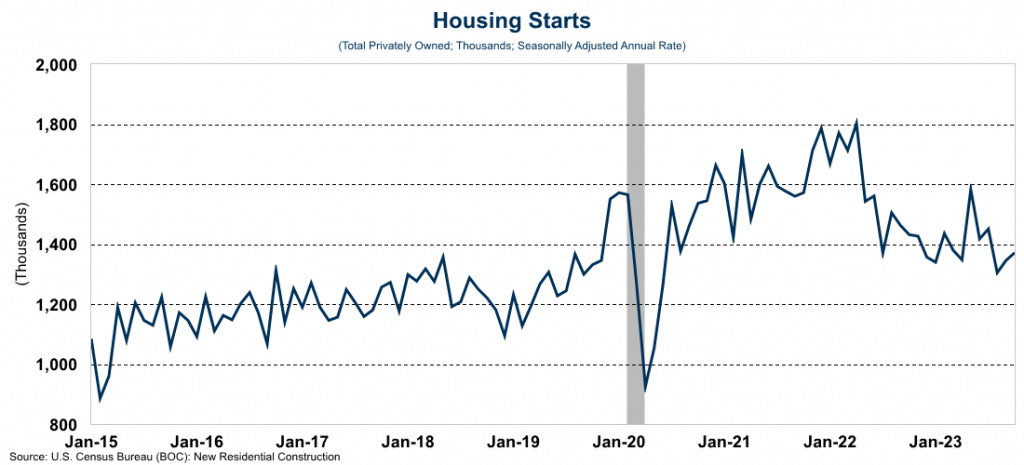
However, even with declining confidence, new home construction rose 1.9% in October as demand for new homes continues to be driven by the fact that no one is selling their existing home with a low-rate mortgage.
Final Comments...
Next week is Thanksgiving and given the shortened work week, the update will be sent out on Wednesday. The Purchasing Managers Index (PMI) for both manufacturing and services will be released on Friday, but will be reported on in the update for the following week.