

Weekly Economic Update 12-05-25: ISM Manufacturing & Services Indices; and ADP Employment; Industrial Production & Capacity Utilization; and Factory Orders
Slowly but surely the data is starting to come back and catch up.
The views and opinions expressed in this post are solely those of the author and do not necessarily reflect the views of the Georgia Institute of Technology or the Georgia Board of Regents.
As expected, last week’s Black Friday post was the least-read post of the year. However, it didn’t stop several of you from sending me emails, questioning my dislike of Thai food. My only response is to point to a Latin phrase often used in economics: “de gustibus et coloribus non est disputandum,” which literally translated means “when we talk about tastes and colors, there is nothing to be disputed,” or put another way…there is no accounting for taste.
Speaking of Black Friday, according to Adobe Analytics, consumers spent $6.4 billion on Thanksgiving Day and another $11.8 billion online on Black Friday, both of which were record highs and up significantly from last year. The latter number was 9.1% over last year. However, average prices were up more than 7% over last year, so much of that “growth” was actually just inflation.
On Cyber Monday, sales were up 7.1% over last year…but again, that growth was simply inflation. In fact, there was other data to suggest that order volume was actually down. Spending +7.1% to acquire negative volume growth isn’t a sign of economic strength...it is the very definition of an inflationary squeeze. There is a reason that the theme of the upcoming 2026 mid-term election will be “affordability.”
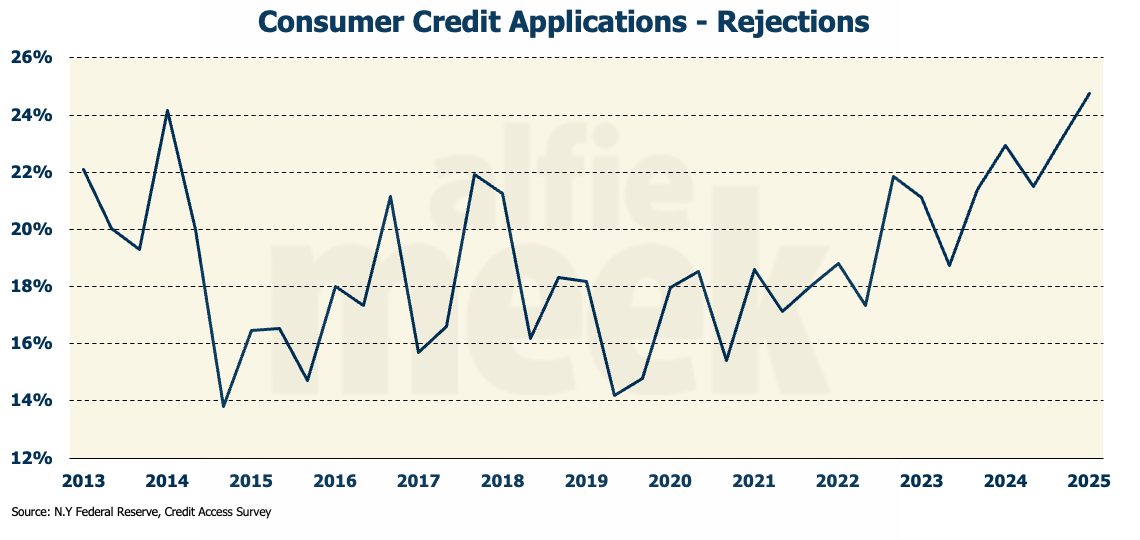
Of more concern is the fact that “buy now, pay later” accounted for almost $800 million of the Black Friday sales. As I have been saying, consumers appear to be tapped. Recent data from the New York Federal Reserve Bank shows that consumer credit applications are now being rejected at almost 25% - the highest rejection rate ever recorded.
This suggests that either consumers are maxed out on their credit cards, or they have stopped making payments on the credit they already owe. On a year-over-year basis, new foreclosures are running 32% over last year, and new bankruptcy filings are up 12% - further evidence that the position of the consumer is weakening.
Before I get to the data, I have one other note… long-time readers will remember an old segment called “stupid economic statement of the week.” It has been a while since I included this segment, but on my way to work Wednesday morning, I heard an interview with Rep. Mark Alford (R-MO), who made the following statement: ” Everyone wants lower prices, but we don’t want deflation.”
Uh…what? The technical definition of “deflation” is “a decrease in the general price level of goods and services.” So, yes, if you want “lower prices,” by definition you want “deflation.” Perhaps he means he wants a lower rate of inflation where prices rise, but at a slower rate? Who knows what he means? I don’t think even he knows. Like most politicians, he knows enough to be dangerous…lower prices = good (because he gets re-elected), but deflation = bad (because it can lead to a deflationary spiral and falling demand). I am picking on Rep. Alford because I happened to hear him on the radio, but this kind of nonsense is rampant with our elected officials. With such a gross lack of economic knowledge by our political class, is it any wonder we are $38 trillion in debt?
Not much data this week as the federal government employees are still trying to catch up. But hopefully, we will be back to a normal release schedule by the first of the year.
ISM Manufacturing
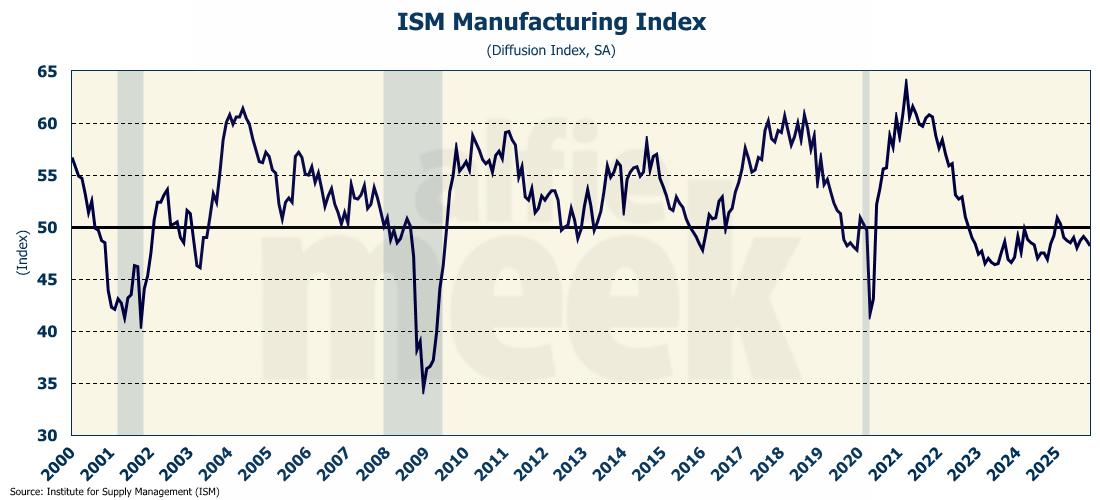
The Institute of Supply Management (ISM) Manufacturing index fell from 48.7 to 48.2 in November, well below the expected increase to 49.0 (full release here). This is the ninth consecutive month of contraction for the manufacturing sector. In fact, the sector has been in decline for 34 of the past 35 months.
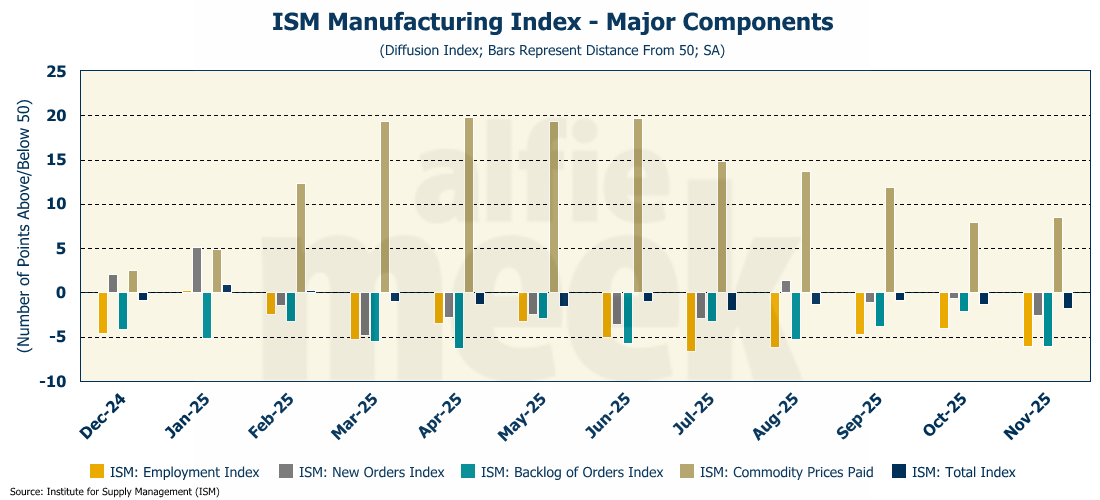
For the third consecutive month, every subcomponent of the index declined, with the obvious exception of “Commodity Prices Paid,” which continues to climb. Both new orders and employment continue to decline, which does not bode well for the economy in 2026. Respondents largely blamed the current poor performance on the chaos caused by the government shutdown and the uncertainty surrounding the daily changes in trade policy. In addition, respondents commented that the introduction of AI is also producing disruptions and often generates “inaccurate information,” which, in turn, causes consumers to be wary which then make it very difficult to forecast demand. In short, the AI revolution in manufacturing is still in its infancy, and there are some serious issues to be worked through.
ISM Services
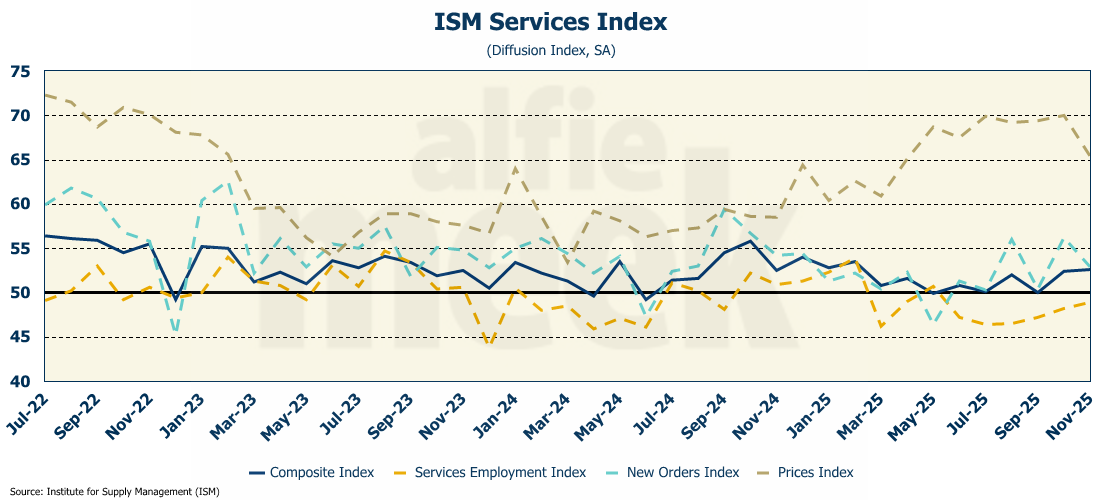
Once again, manufacturing may be down, but the service sector, as measured by the ISM Services index, continues to expand (full release here). The index rose from 52.4 to 52.6, much better than the 52.0 that was expected. Services employment, while still in “contraction” territory, moved closer to 50, rising 0.7 points to 48.9. Also, service industries reported seeing slower growth in prices. In total, the service sector seems to have put the “tariff” scare behind it and is well-positioned heading into 2026. The only question is the strength of the consumer.
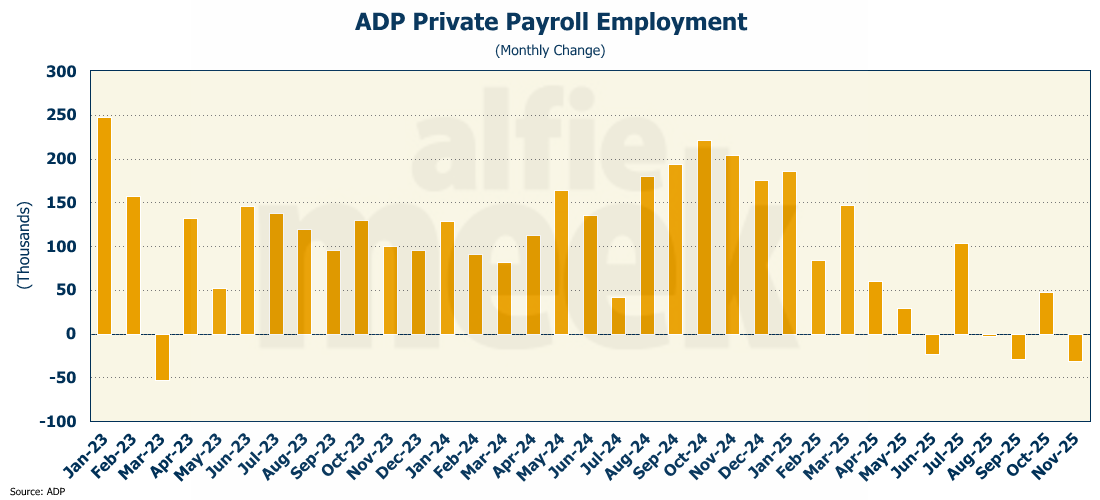
ADP Employment
Since employment data is still hard to come by, I will continue to rely on the ADP employment reports, and for November, the news wasn’t good. According to ADP, private sector payrolls fell by 32K last month, the largest monthly decline since March 2023 (full release here). According to ADP, four of the last six months have posted a decline in private sector employment.
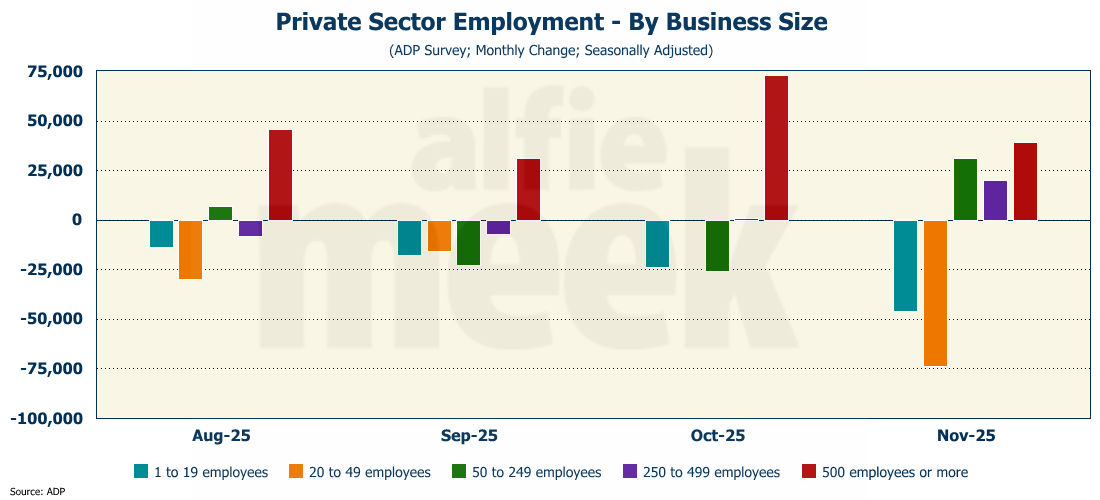
Interestingly, the decline was driven entirely by job losses in small businesses, with businesses less than 50 employees dropping 120K employees.
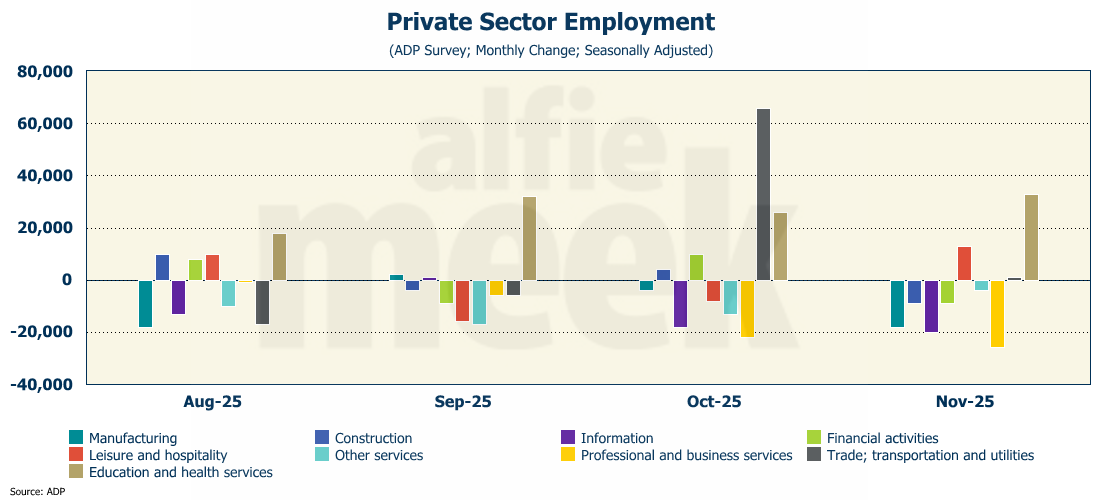
And the job losses were broad-based, with losses spread across both goods-producing and service industries. Only “leisure & hospitality” and “educational services” posted any type of significant job gains.
Hopefully, we will soon start getting “official” employment data from the BLS, but for now, the ADP data shows a significantly weakening job market.
Industrial Production & Capacity Utilization
Still catching up from the government shutdown, the Census Bureau released the long-delayed September data for industrial production and capacity utilization (full release here). Production rose just 0.1% in September; however, it was up 1.6% on an annual basis, the highest annual growth rate since November 2022. Manufacturing output was unchanged in September, as the sector continues to struggle.
Further evidence of that struggle is the weakness in capacity utilization, which fell to only 75.9% in September, far below the 77.4% posted in August. Given the ISM manufacturing index above, none of this should be a surprise. The sector is clearly in recession.
I would love to have some graphs to show you, but apparently, the data service, for which I pay an exorbitant amount of money, has been unable to update the data for the last three days, so I don’t have an updated graph.
Factory Orders
As with industrial production, the Census Bureau also released the delayed September reading for factory orders (full release here). With industrial production weak, it isn’t surprising that factory orders also disappointed, rising only 0.2% in September. Manufacturing, less the volatile transportation sector, also rose 0.2% for the month.
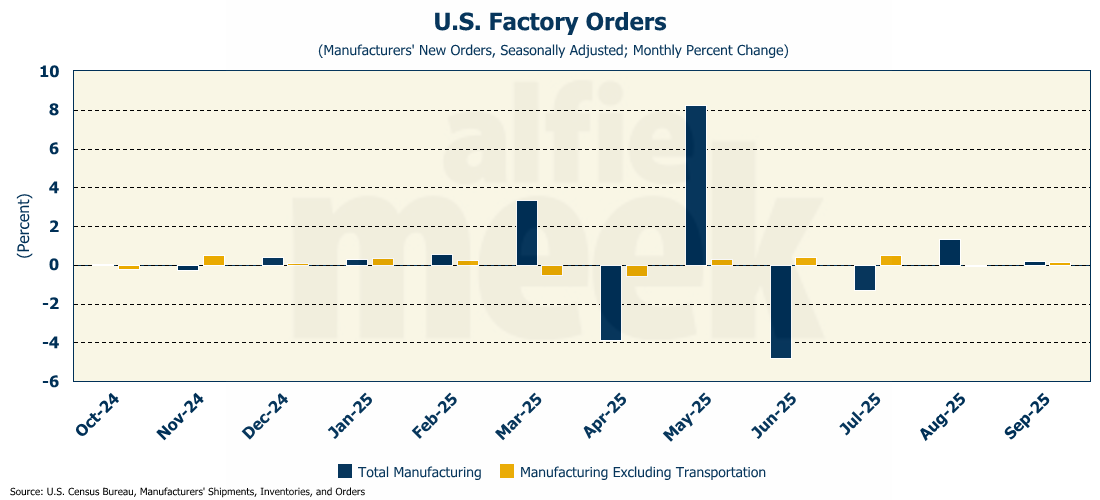
If there was a bright side, core durable goods orders (durable goods less transportation) rose for the 6th straight month and are up 3.1% for the year. The data may be a bit old, but it does show some bright spots heading into the fourth quarter.
One More Thing…
Sorry for the shorter-than-usual update…I have been quite sick this week.
As promised, this morning I will be cancelling all recurring bronze and silver subscriptions on the Buy Me A Coffee site. After today, if you are a bronze, silver, or monthly supporter, you should no longer see a charge. (Gold members will still be managed through Buy Me A Coffee since SubStack doesn’t allow a third level of support.)
Beginning January 1, this weekly update will move to paid-subscription only. If enough people sign on, I will keep it up. If not, I’ll wrap it up in the spring. After nearly two and a half years and 122 consecutive weekly posts, it is time to see if this is worth continuing. I hope many of you will find at least $8 worth of monthly value in what I write each week.
The Weekly Economic Update is sponsored this week by:
