Weekly Economic Update 12-1-23: New Home Sales; Consumer Confidence; Personal Income; and PCE Inflation
The views and opinions expressed in this post are solely those of the author and do not necessarily reflect the views of the Georgia Institute of Technology or the Georgia Board of Regents.
There seems to be no end to the American consumer's ability to spend. Or more accurately, to their addiction to spending...regardless of "ability." Consumer's "ability" to spend can be debated. But the headlines are clear....Black Friday sales set a record!
First of all, can we all agree that any naturally increasing series will, by definition, always be "setting a record?" If population and prices are trending up (which they always do) then we will always be "setting a record" on spending. A friend of mine just turned 52. The headline "Bob sets a new age record!" is just as informative as "Black Friday spending sets a record!" That is to say...they are both generally meaningless.
Second, while online sales were up 7.5% from last year, TOTAL sales were up only 2.5%. Given that inflation is running 3.2% (based on the current CPI readings) that means that in real terms, we bought LESS than last year.
In fact, a recent survey conducted by WalletHub of consumers to learn what they are planning to spend this holiday season shows that more than 1/4 of say they will spend less this year than they did last year (and that is BEFORE any inflation adjustment). Some other findings that are shocking, if not scary.
More than 1 in 3 Americans are foregoing gifts this year due to inflation.
Nearly 1 in 4 Americans still have holiday debt from last year!
Nearly 1 in 5 people will apply for a new credit card to help with holiday shopping.
Nearly half of Americans say their charitable giving is affected by inflation.
28% of people will spend less than last year on their holiday shopping.
Given that interest rates on credit card balances are at 21%, that is some expensive Christmas shopping. If you had just a $1,000 balance, and made only minimum payments at 21%, (and didn't add to your balance) you would be in debt for 40 months and pay $390 in interest.
To quote Will Rogers....if you are in a hole...STOP DIGGING!!
Consumer Spending & Income
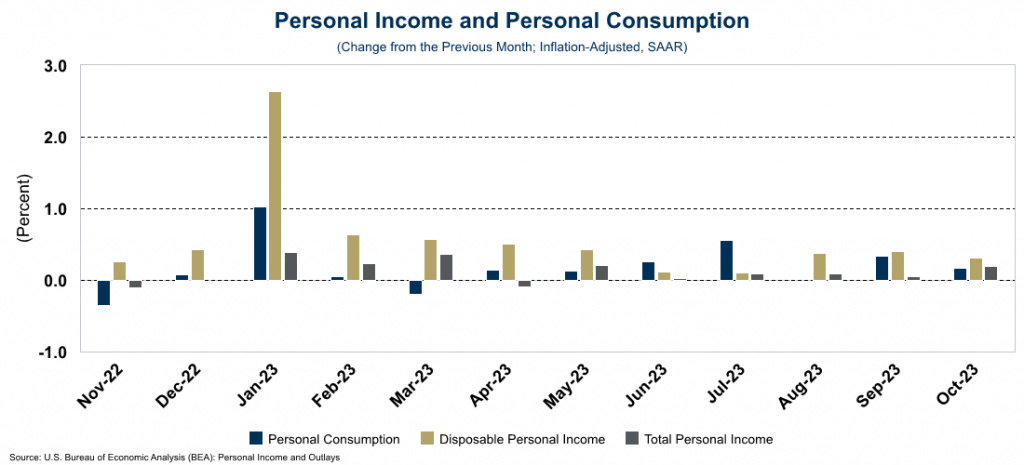
And MAYBE that is what the consumer is starting to do! Consumer spending in October only rose 0.17% which was exactly half the pace of September. October spending focused on health care, housing and utilities — all necessities — while the purchase of cars was reduced (likely a result of high prices and higher interest rates.)
Total personal income growth also slowed, growing at only 0.31% in October. Given that income grew faster than spending, the savings rate ticked up a little to 3.8%. Higher interest rates are slowing consumer's willingness to spend on big-ticket items such as cars and it is also discouraging business investment.
New Home Sales
This week the Census Bureau released data on the sales of new homes in October. In addition, they revised the data from September down significantly (from 759,000 units to 719,000 units). Economists were expecting a rate of 725,000 in October, but the number came in at 679,000...a 5.6% drop. Because existing homes are in such short supply, builders are providing the bulk of the available home inventory with new homes. The supply of new homes rose 1.4% in October, equating to a 7.8-month supply. That’s up from a 7.2-month supply in September. But high mortgage rates are having a dampening effect on sales. As we pointed out last week, the difference between the cost to buy vs. rent has widened considerably over the past two years, which is driving many people out of the housing market, as owning a home has simply become far too expensive.
However, at least with respect to new homes, the prices are starting to come down. The median price dropped $13,000 from September to $409,300 in October. Year-over-year, prices are down 17.6% from October 2022. That is the sharpest one-year decline in new home prices since the data series began in 1964!
Case-Shiller Home Price Index
But new homes were only about 15% all homes sold in October. The other 85% are existing homes, and as we showed last week, those prices are still going up! According the data released this week by Case-Shiller, home prices in the 20 biggest metro areas rose for the seventh month in a row in September and hit a record high! Even cities like Dallas and San Francisco (where prices had been falling) posted price increases. In fact, only three cities - Portland, Phoenix and Las Vegas - posted price declines. On an annual basis, prices are up 3.9% in aggregate across these 20 major metros. The total national index, a broader measure of home prices, was also up 3.9% over the past year.
Consumer Confidence
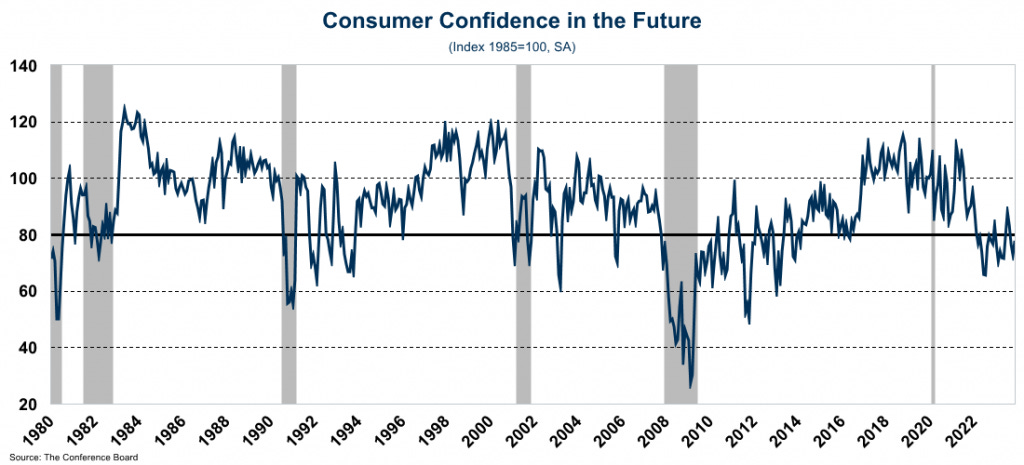
The Conference Board reported that consumer confidence rebounded in November from a 15-month low in October. The jump was driven entirely by an improvement in their confidence in the future which rose significantly in the month but is still below 80, which has historically signaled a recession. In fact, the Conference Board reported that when asked, Americans are still worried about a recession, as well as high interest rates and significant inflation that has raised prices 18% since 2021 and eroded their standard of living.
Third Quarter GDP (Preliminary Estimate - First Revision)
A month ago when the advance estimate of 3Q GDP was released, it came in at a whopping 4.9%. At the time I predicted that would be revised down. I think it is important for economists to own it when they are wrong,,,and I was wrong. The "preliminary" number was released on Wednesday and 3Q GDP was revised UP to 5.2%!
However, I still find this number very hard to believe. Again, remember that according to the BEA, for the first time since the first quarter of 2021 (10 quarters ago), residential fixed investment was a positive contributor to the economy but during the quarter housing starts were at their lowest level since 2019 (excluding the pandemic). Second, according to the BEA, personal consumption contributed 2.4% of the growth while real retail sales were negative for all three months of the quarter.
Another major contributor to the growth (after personal consumption) was the change in private inventories. But the largest adjustment between the "advance" and "preliminary" estimates came from government spending which represented 0.94% of the growth. In fact, government spending has been a major driver of GDP growth for the past 5 quarters.
Interestingly, corporate profits were down from 3Q 2022, and that represented the second quarter in a row where corporate profits posted a year-over-year decline. People may be spending, but it isn't showing up in the profits of corporations, suggesting that perhaps corporations are not able to pass on the full extent of their increased costs to consumers. And, as we mentioned earlier, higher interest rates are discouraging business investment and many companies are facing much higher financing costs as debt comes due and has to be refinanced.
PCE Inflation
According to the Fed's preferred inflation measure, the Personal Consumption Expenditure (PCE) Index, inflation continued to cool in October. The overall index was down to 2.9% (Y-Y) in October due in large part to the plunging price of oil. Core PCE (PCE less food and energy) also dropped and now sits at 3.5% year-over-year. The PCE for services also declined, and now sits at 4.4% year-over-year. (As a reminder, PCE measures the price changes in the things people actually buy as opposed to CPI which tracks price changes of a fixed basket of goods.)
The numbers are still well above the Fed's 2% target, but are certainly moving in the right direction. The consensus seems to be that the Fed Funds rate is now high enough to get inflation down to the target by sometime in the next year or two. Certainly, the graph I posted two weeks ago would suggest that to be the case. This assumes of course that the Fed doesn't have to step in and purchase government debt as the lender of last resort. That remains a real possibility.
ISM Manufacturing PMI
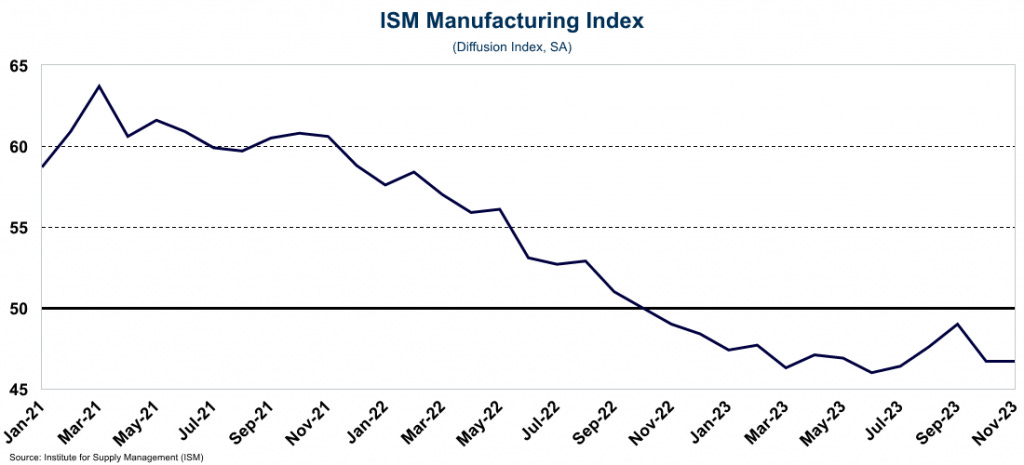
Finally this week we got the ISM Manufacturing Purchasing Managers Index (PMI) which came it at 46.7, the same level as last month. The expectation was that both new orders and employment would raise the index slightly in November. That did not happen as manufacturing employment actually declined for the second month in a row. Overall, the index remains below 50, and has been for 1 year indicating that the manufacturing sector is still contracting. According to ISM, a reading of 46.7 corresponds to a change of -0.7% in real GDP on an annualized basis.


