Weekly Economic Update 3-1-24: New Home Sales; Case-Shiller Home Prices; Durable Goods; ISM Manufacturing; Consumer Confidence; Personal Income & Spending; PCE inflation; and Revised 4th Quarter GDP
The views and opinions expressed in this post are solely those of the author and do not necessarily reflect the views of the Georgia Institute of Technology or the Georgia Board of Regents.
I don't read a lot of science fiction, but I do enjoy reading author Andy Weir. You are probably most familiar with his book The Martian which was turned into a movie starring Matt Damon. While, The Martian was good, my favorite book of his is Project Hail Mary and last weekend, while traveling, my wife and I listened to another one of his books Artemis. In the last chapter, the main character is wrapping up a conversation and as she leaves the room she says to herself:
"I didn't want to spend any more time inside the mind of an economist. It was dark and disturbing."
My wife (a psychologist) burst out laughing, and I have to admit, given my somewhat unfair reputation, it was kind of funny. And on that note, let's dive into this week's economic data....
New Home Sales
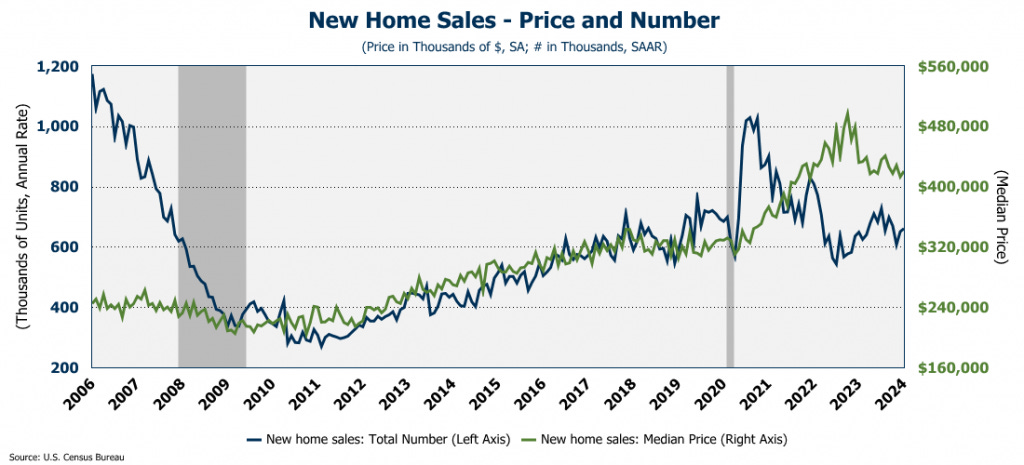
Sales of new homes rose in January to an annual rate of 661K, but the increase was far below expectations of 680K units. Even so, with mortgage rates averaging 6.64% in January, the increase was a welcome sign. In addition, the median price rose $7,600 to $420,700. Even with the rise in median price, it is still down 15.3% from the peak in October 2022.
On a regional basis, the pace of new home sales was dampened by weakness in the South. In fact, the rest of the nation posted an increase in the sales of new homes, while the South posted a 15.6% drop.
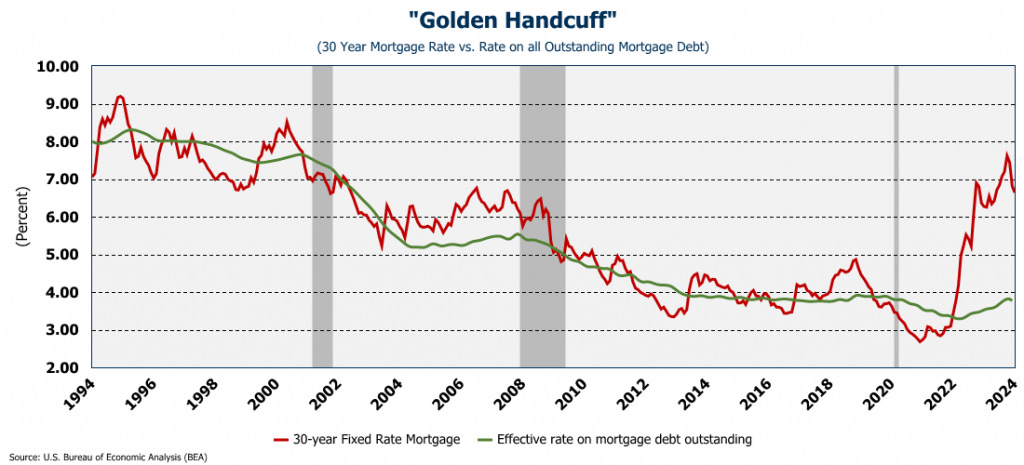
With mortgage rates still "high" relative to recent history, people are unwilling to let go of their current home. There is still a 300 basis point difference between the current 30-year mortgage rate, and the rate on all outstanding mortgage debt. The latter is rising slowly, but is still well below 4%.
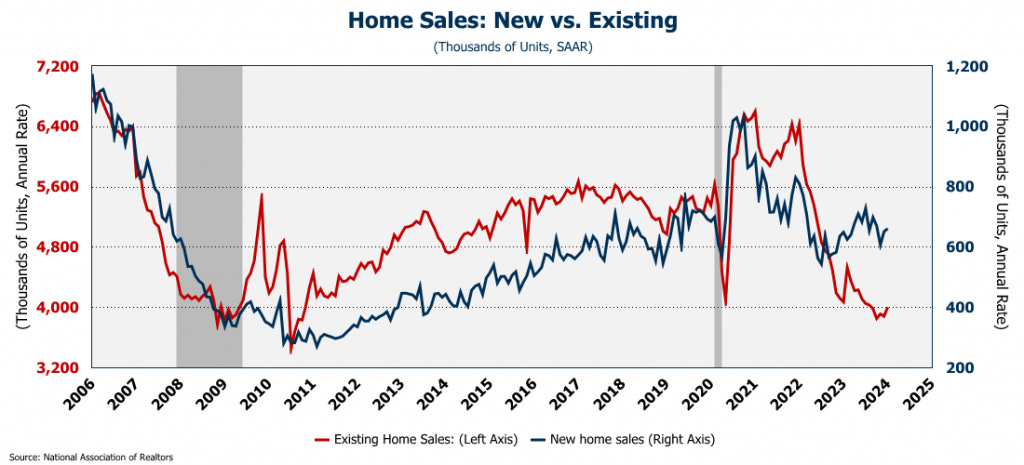
This, of course, is severely limiting supply which is pushing people toward new builds. As such, simple supply-and-demand continues to support the median prices. Currently, new homes account for about 14%-15% of total home sales, versus about 8%-9% historically. As you can see, the two previously moved in a consistent pattern with one another, but they have now completely decoupled.
Case-Shiller Home Price Index
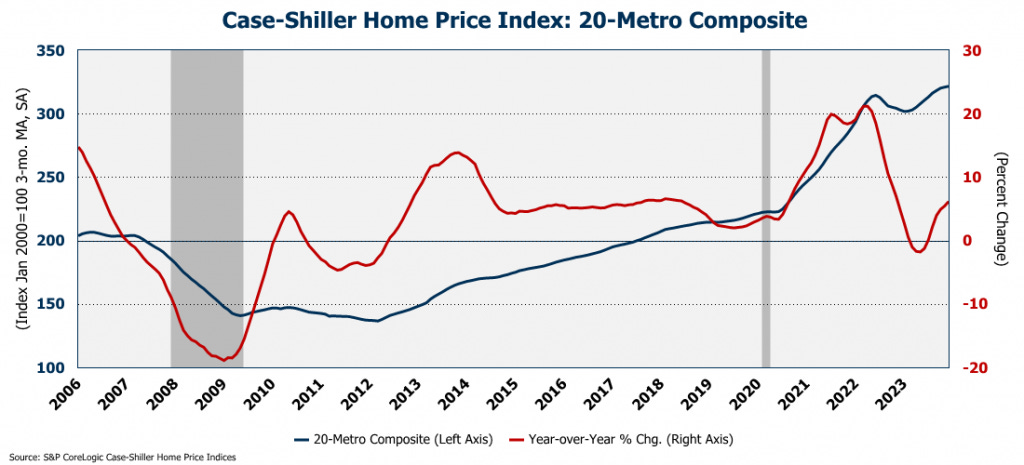
The Case-Shiller Home Price Index for December was released this week, and confirms a lot about what we already know about housing. The index is somewhat delayed, but in December, the index for the 20 largest metro areas rose for the 11th consecutive month and posted a record high. According to the index, the prices in the 20 largest metros are 6.2% higher than they were a year ago, and for the nation as a whole, prices are 5.5% higher. Again, as previously mentioned, this price support is due to the persistent shortage of homes for sale. And, with mortgage rates remaining high, this is unlikely to change.
Durable Goods
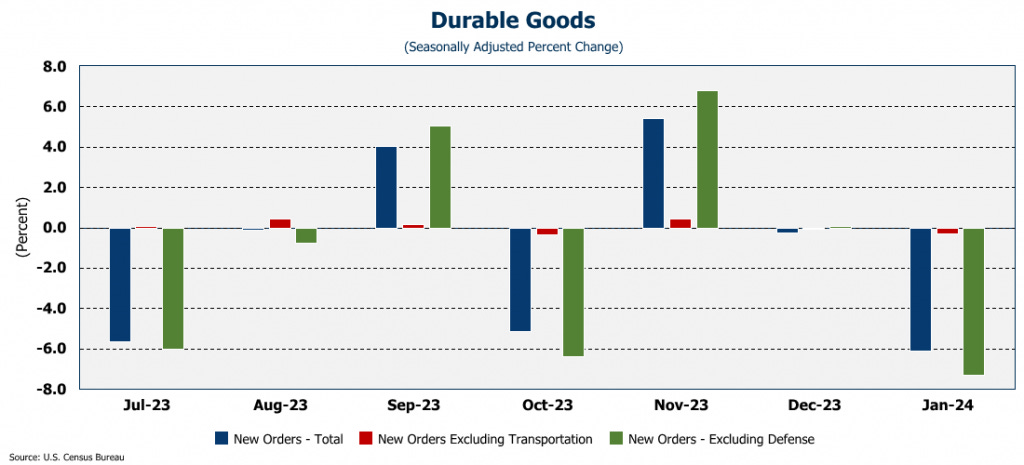
New orders for durable goods dropped sharply in January, down 6.1% from December. Economists had expected a drop of only 4.8%. New orders excluding transportation were expected to rise in January, but actually declined 0.3%. New orders excluding defense orders dropped 7.3%...the biggest drop since the first months of COVID. In short, the only positive part of the January durable goods report was the defense sector, but regular consumers are not ordering durable goods.
ISM Manufacturing Index
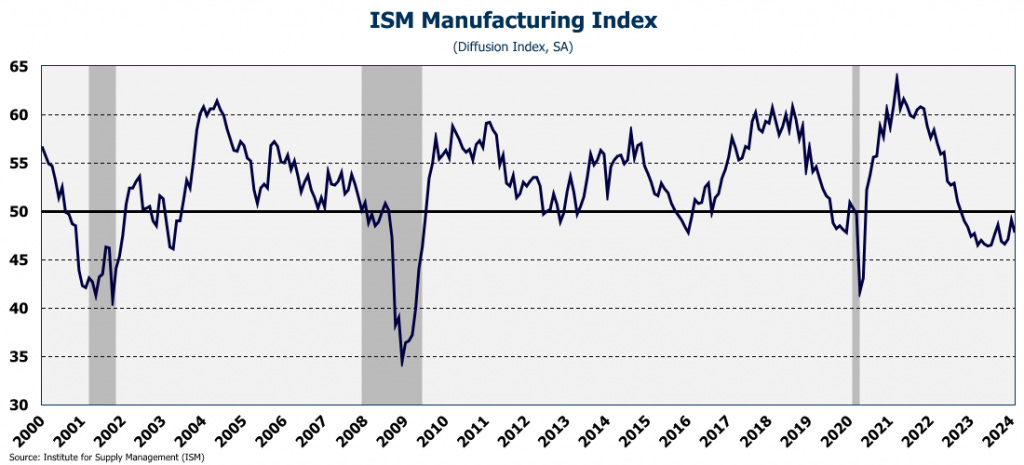
Despite expectations of improvement, the ISM Manufacturing Index dropped in February, indicating that U.S. manufacturing is still in recession. The index has been below 50 (an indication of contraction) for the past 15 months. The major components of the index were all down including new orders, backlog of new orders, and employment.
Consumer Confidence
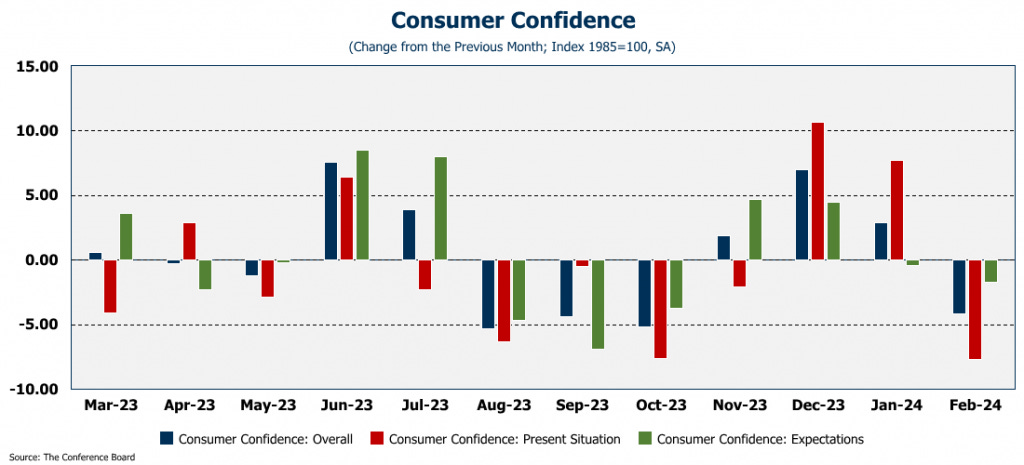
After three months of growth, consumer confidence fell in February. Survey respondents cited economic uncertainty and persistent inflation as concerns, although they are less concerned about food and gas prices. In addition, they are concerned about the labor market (wait...what? I thought the labor market was strong?!?) as well as the political environment with the 2024 Presidential contest right around the corner. And the decline was across the board as confidence in both the present situation and future expectations fell in February.
The more interesting part of the report, however, were the revisions to previous months. In January, I discussed this at length with respect to the employment data, and now the Conference Board is doing the same thing! For the fourth consecutive month, the consumer confidence data was revised significantly lower! Can someone explain to me how that works? Do you ask them all again and they say "you know, come to think of it, two months ago I wasn't feeling as good about the economy as I thought I was"? I am starting to think that a core characteristic of modern economics is that everything is revised lower two months after nobody cares!
Personal Income & Spending
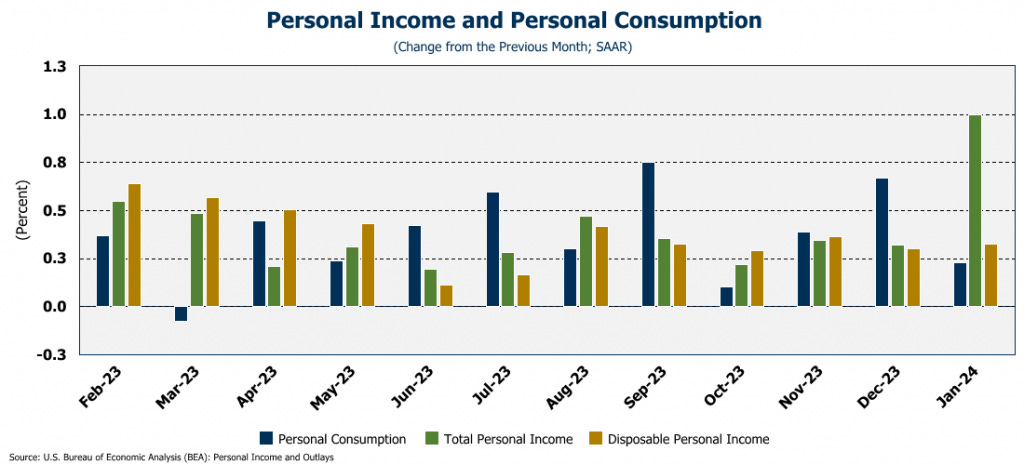
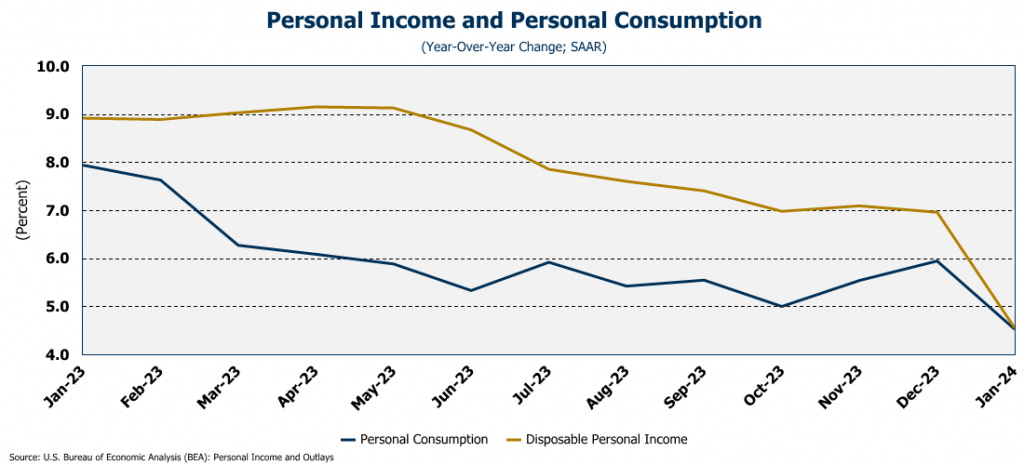
Both personal income and spending grew in January (on a nominal basis) with income jumping 1% over December levels. Disposable personal income was up 0.3%, growing slightly faster than spending which was up 0.2% in the month. However, on an inflation-adjusted basis, both personal income and consumption were down in January.
Despite the positive nominal numbers, it is clear that both income and consumption are slowing. Annual growth for both measures trended down for all of 2023, and both fell off sharply in January to just over 4.5%. For personal spending, (which is a major component of the U.S. economy) that the lowest level since early 2021.
PCE Inflation
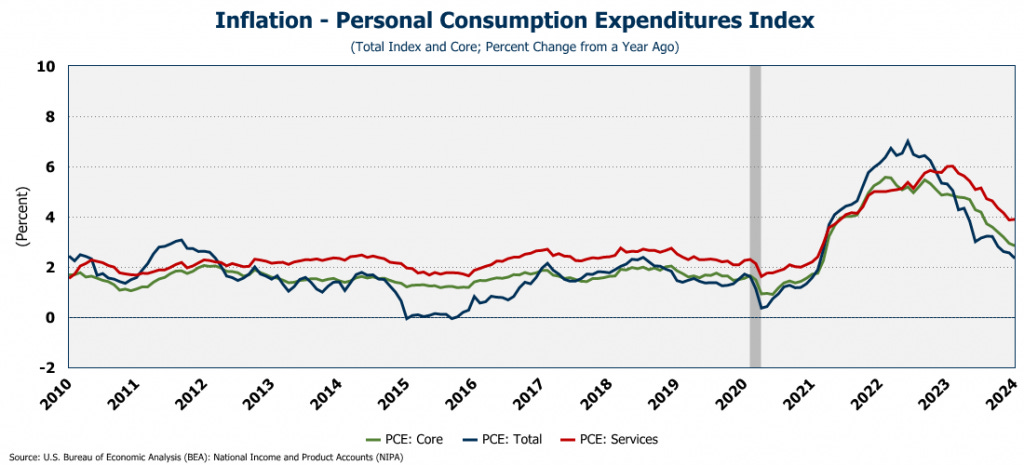
Inflation, as measured by the Personal Consumption Expenditures (PCE) Index, came in just as expected at 2.4% year-over-year. Core PCE (PCE ex. food and energy) came in at 2.8%, and PCE for service is still high at 3.9%. To look at the graph, everything appears good...inflation is heading down, and while it is still above the Fed's target, it is moving in the right direction.
There is just one problem. Inflation is actually getting a lot hotter. Yes, compared to a year ago it is moving in the right direction, and that is what everyone in the media will report. However, if you take the month-to-month changes in the index, and annualize them, PCE has been accelerating since November, and is now running over 4%! January core PCE is running over 5% on an annualized basis, and January services PCE came in at 7.4% on an annualized basis! That is NOT what the Fed wants to see and it makes rates cuts any time soon much less likely. In fact, the evidence seems to suggest that current Fed policy is not sufficiently restrictive to return inflation back to 2%.
Revised 4th Quarter GDP
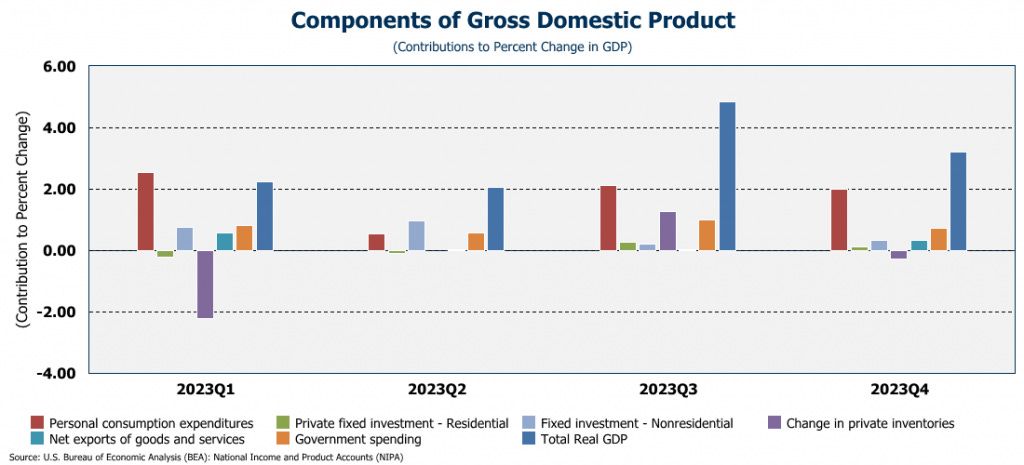
And finally, this week, we got revisions to 4th quarter GDP. The Commerce Dept. revised GDP for the final quarter of 2023 down slightly to 3.2%. There weren't a lot of changes, and I discussed 4th quarter GDP in depth last month, so I won't rehash that all here, except to point out again that it was spending by both the over-extended consumer, and the over-extended government that kept the economy afloat. In the preliminary estimate last month, they respectively represented 1.9 and 0.6 points of the 3.3% growth. Both were revised UP, and they now respectively represent 2.0 and 0.7 points of the 3.2% growth. Another notable change is that private inventories actually declined, rather than the increase posted in the preliminary estimates.
But again, what is more disturbing is that nominal GDP grew $334.5 billion in the fourth quarter, but we accomplished that by increasing the federal debt by $834.2 billion over the same period! In other words, it cost an additional $2.49 in government debt to generate $1 in economic growth. That isn't sustainable.
Looking forward to 2024, the National Association of Business Economists (of which I was once a member) released their forecast this week. This group represents the leading economists in the country, and their consensus forecast for 2024 is that GDP will grow 2.2%. This is an increase from their previous estimate of only 1.3%. To put that in perspective, it is generally accepted that the "sustainable" growth rate for the U.S. economy is 1.8%. So, in essence, these economists are saying that in 2024, the economy will be hot and perform well above expectations.
I just don't get it. I guess they are looking at different data than I am. Consumer debt is growing; interest rates remain high; inflation is accelerating; manufacturing is contracting; consumption is slowing; job growth is largely focused in part-time work; consumer confidence is down; and GDP growth is driven by debt-riddled consumers and a virtually bankrupt government.
"I didn't want to spend any more time inside the mind of an economist. It was dark and disturbing."


