
Weekly Economic Update 03-21-25: Consumer Sentiment; Retail Sales; Home Builder Confidence; Building Permits & Housing Starts; Existing Home Sales; and Industrial Production
Consumers appear to be concerned, but the industrial sector is on fire.
The views and opinions expressed in this post are solely those of the author and do not necessarily reflect the views of the Georgia Institute of Technology or the Georgia Board of Regents.
First off, let me congratulate the Wall Street Journal! Earlier this week on Monday, they published an article with the following headline:

Of course, if you subscribe to this update, you read about that last week when I made this exact same point in my introductory comments. Glad they finally caught up.
Next, as you are no doubt aware, the Federal Reserve met this week to decide what to do about interest rates. They decided to do nothing.
But what choice did they have? They can’t raise rates in the face of a falling stock market and slowing economic growth, nor can they cut rates in the face of rising inflation.
Below are some highlights from the meeting, with my commentary in parenthesis:
They expect 2 rate cuts this year. (Won’t happen. At MOST there MIGHT be one.)
Slowing the pace of balance sheet runoff from $25B/month to $5B/month. (Less quantitative tightening. They are getting ready to have to expand the balance sheet and absorb the debt that is going to have to be refinanced plus new debt to cover our growing deficits.)
The unemployment rate forecast raised to 4.4%. (I might have gone a little higher.)
Economic growth outlook adjusted down from 2.1% to 1.7%. (So, the economy is slowing. Why not cut rates? Wait for it….)
PCE inflation forecast revised UP from 2.5% to 2.7% and core PCE inflation forecast (their favorite measure) revised up from 2.5% to 2.8% for the year. (There it is! They KNOW that inflation is increasing! They can’t cut rates in the face of that.)
So, by their own admission, we are going to have slow economic growth and rising inflation. We have a word for that….stagflation. IF their own forecast holds, that is where it is headed. Just 11 months ago, Chair Powell was asked about stagflation and he famously replied “I don’t see the stag or the flation.” I wonder if he is seeing it now?
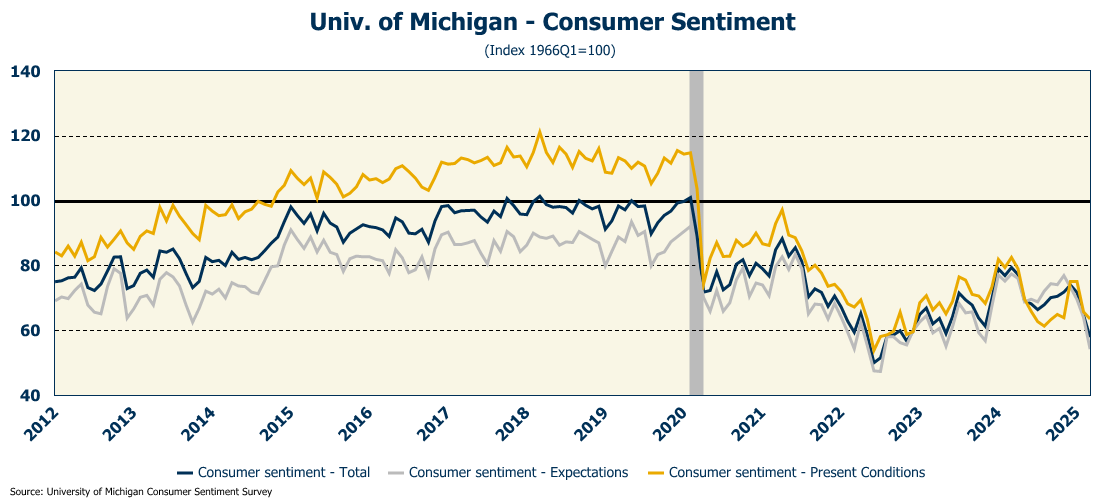
Consumer Sentiment
The University of Michigan released its preliminary numbers for February consumer sentiment, and sentiment plunged to 57.9, one of the lowest levels seen since inflation was running rampant in 2022 (full release here). Consumers are concerned about both the current situation as well as conditions in the future. However, an interesting story emerges when you look at the data by political party affiliation. Republican sentiment about the economy is up around 83.9 while Democrat sentiment is running at 41.4 - the lowest reading EVER, including during the global financial crisis and COVID.
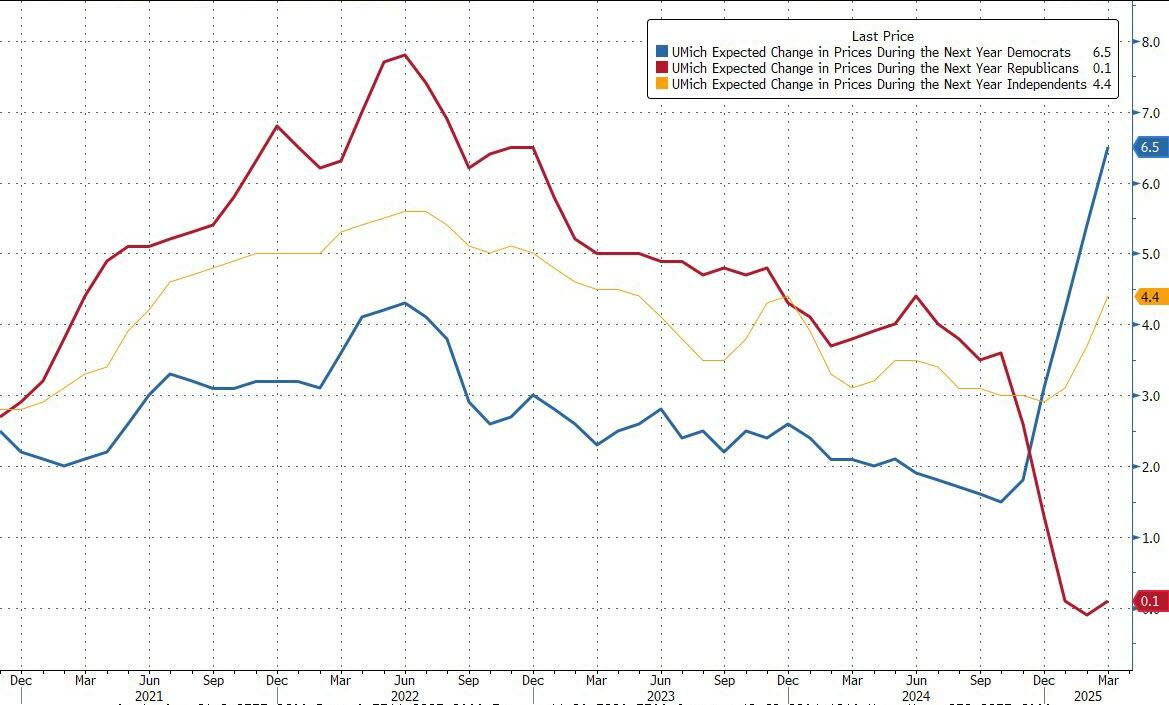
But what really stood out most in the report were the one-year and five-year inflation expectations. The one-year inflation expectation rose to 4.9% while the five-year outlook for inflation absolutely exploded to 3.9%! That is the highest that number has been since 1993!

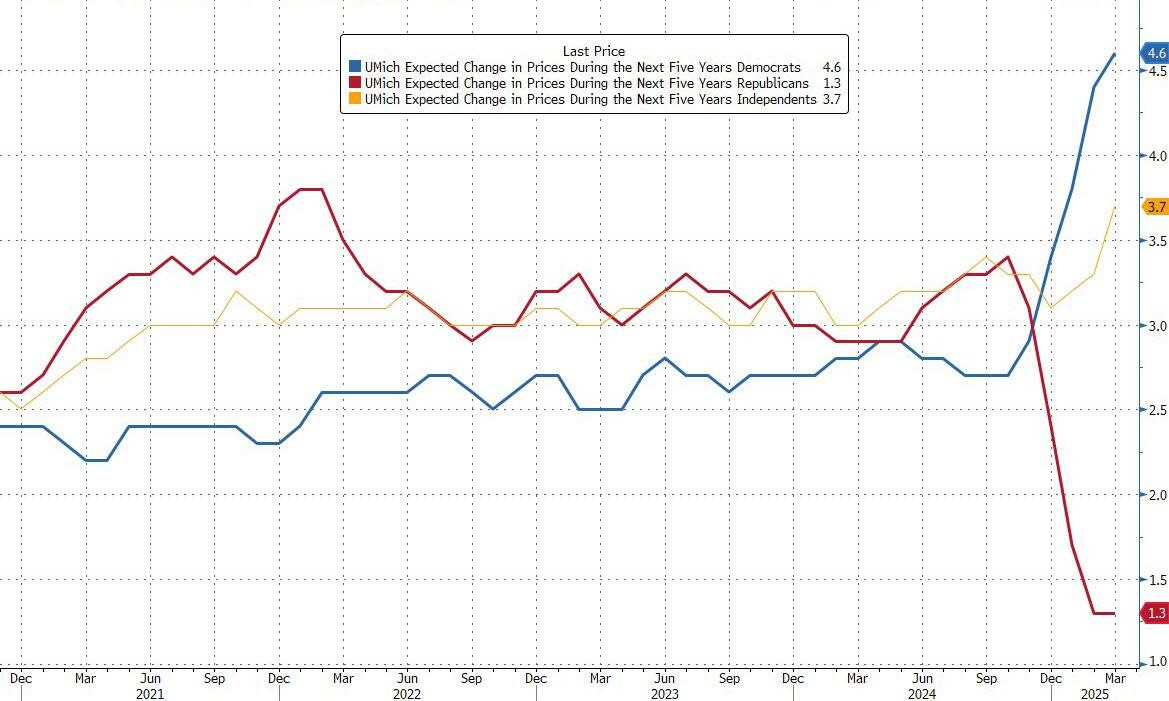
However, once again, as has been the case since the election, party affiliation totally explains the jump. The difference is most stark looking one year out where Democrats are expecting 6.5% inflation while Republicans see it as virtually flat. Five years out, Democrats are expecting 4.6% inflation while Republicans are expecting only 1.3%. Clearly, both of these groups are letting their politics color their opinion of inflation. The truth is probably closer to where the independents see inflation - 4.4% one year from now, and 3.7% in five years.
There is a reason we track and report on inflation expectations. Consumers’ view of future inflation influences their demand for wage increases. As such, inflation expectations can be self-fulfilling. It is interesting to note that the New York Federal Reserve also asks consumers about their expectations of inflation one year out, and that survey is only running at 3.1%. Maybe the University of Michigan should take a closer look at its sample population because it seems overly partisan…which makes for poor economic analysis and an utterly worthless indicator. The only thing this survey tells us is that Democrats don’t like Trump and the Republicans do. Thanks for that keen bit of insight Michigan.

Another interesting statistic from this month’s release. Unemployment expectations are now above 2020 levels when we shut down the entire economy for a global pandemic! However, while we don’t have the political breakdown for this data, like inflation expectations, it is likely this data is thoroughly tainted with political bias (on both sides).

Retail Sales
Coming off the dismal consumer sentiment numbers, it is no surprise that February retail sales came in well below expectations (+0.2% vs. +0.6%), even after a significant downward revision in the data for January (full release here).

The largest decline was in food services (restaurants) followed closely by gas stations. However, the gas station decline was likely due to the decline in gas prices, which is a good thing for consumers. In fact, “core” retail sales (total retail sales less automobiles, gasoline, building materials, and food services) were actually up significantly, posting their largest monthly gain since September, led by growth in online shopping. This is important because it is this group that is used for GDP calculations and it grew by more than 2x expectations.

So, it is a mixed bag. The headline number will be reported as a disappointment, but as usual, the story is a little more complicated than the headline, with core retail sales suggesting the consumer continues to spend, which bodes will for first quarter GDP.
Home Builder Confidence
Home builder confidence fell three points in March to 39 - the lowest level in seven months (full release here) despite the fact that the 30-year mortgage rate declined slightly during the month.

Two of the three components of the index - traffic of prospective buyers and current sales - fell during the month, and the third - outlook for the next 6 months - remained steady at 47. Like everyone else, the administration’s threat of tariffs on imported goods has got builders spooked. In addition, builders are concerned about their ability to build and sell homes if the economy starts to slow.

According to the survey, builders are cutting home prices to attract buyers. In March, 29% of builders cut home prices, up 3 points from February. The average price reduction remained at 5%. In addition, 59% of builders used sales incentives, including mortgage-rate buydowns where the builder offers a lower rate to the buyer for a pre-defined length of time before it adjusts upward.
Building Permits & Housing Starts
Building permits in the U.S. fell for the third consecutive month in February (full release here). Both single-family and total multi-family permits were down. However, permits for multi-family housing with 2-4 units were up 5.3%. In total, multi-family building permits are at the same level they were 10 years ago.

As for housing starts, both single-family and multi-family starts bounced back from a decline in January. However, given the recent declines in homebuilder sentiment, and the recent declines in permits, any improvement in housing starts will be short lived.

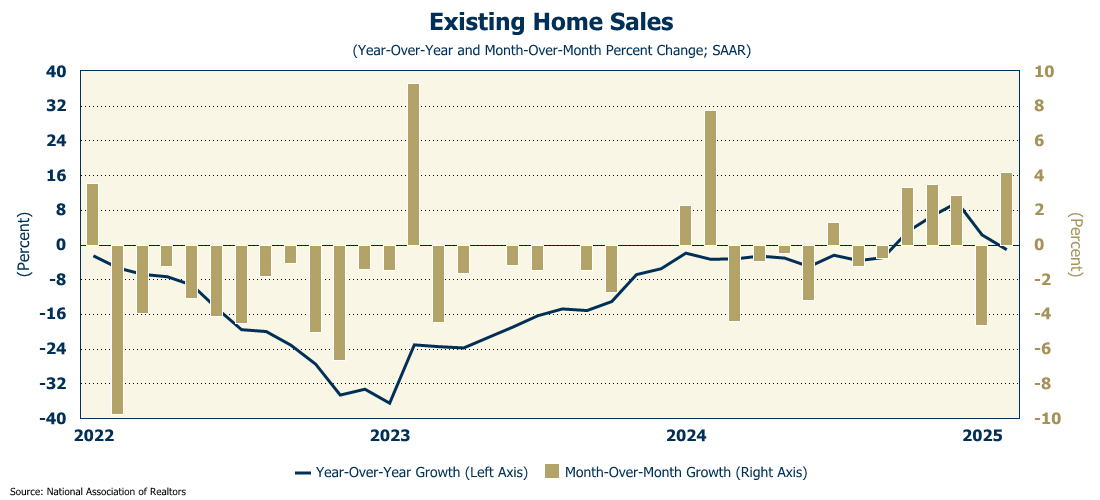
Existing Home Sales
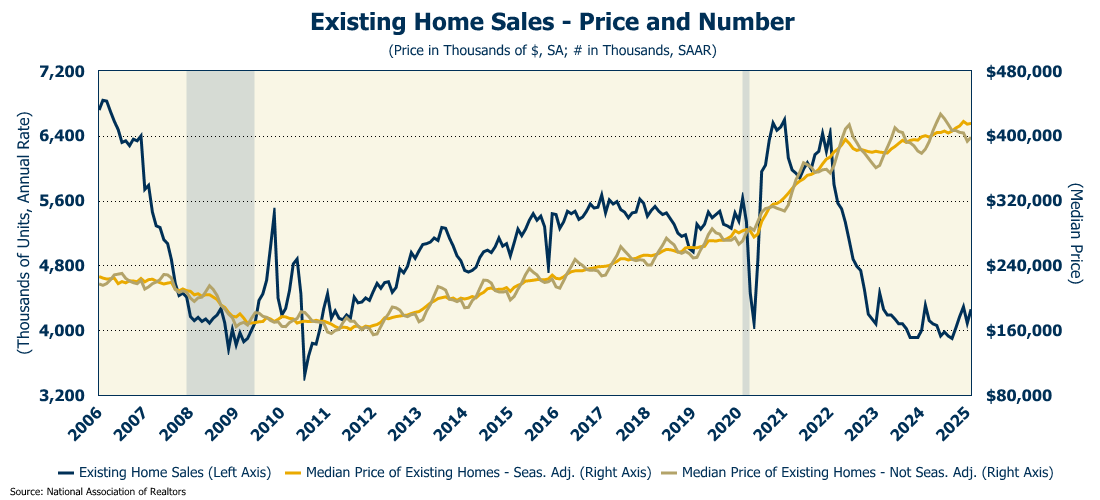
But there is a bit of good news on the housing front. In February, sales of existing homes rose 4.2% to an annual rate of 4.26 million which was the largest monthly increase in a year (full release here). However, on an annual basis, home sales were down 1.2% from a year ago.
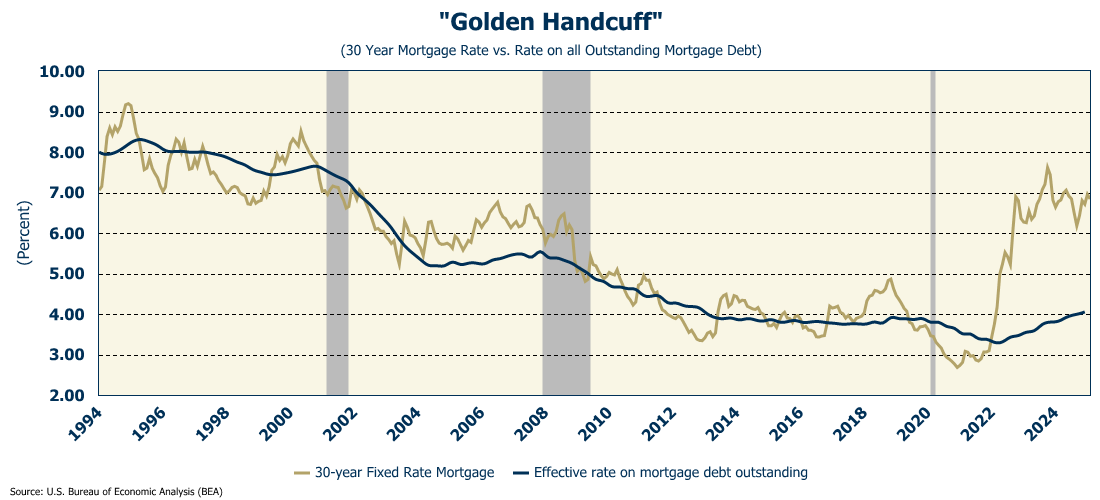
Home buyers are entering the market, but more importantly, those in the homes are starting to put them on the market. The supply of previously owned homes jumped 17% from last February to 1.24 million, the most for any February since 2020. This despite the fact that the difference between current mortgage rates and the average rate on all outstanding mortgages is still 300 basis points.
The median price of an existing home for the month was $398,400 - 3.8% higher than last year. Across the country, 21% percent of homes were sold above list price, and homes received an average of 2.3 offers. First-time buyers made up 31% of all purchases and 32% of purchases were “all cash.”
However, the data did show a big discrepancy between price points. The number of homes sold for over $1 million was up 11.5% from last year, while sales of homes priced $500,000 and below fell on an annual basis. Further evidence of the fact that higher-income households are supporting the economy.
Industrial Production
Finally this week, despite all the talk of recession and economic downturn, industrial production climbed to a record high, moving up 0.7% in February, far better than the 0.2% that was expected (full release here).

Manufacturing output rose even faster (0.9%), with motor vehicles and parts leading the way increasing 8.5%. Excluding motor vehicles, manufacturing output was up 0.4% .

Manufacturing spent the better part of the last two years in recession territory, but the fortunes of the sector appear to be changing. That isn’t good news for those who are looking for additional rate cuts.
One More Thing…
Next Thursday is the Partnership Gwinnett Economic Outlook! Despite the fact that this is unquestionably the most challenging economy to predict, I am looking forward to the event. I hope to see many of you there.
As always, thank you for subscribing and reading this weekly update. If you find it informative, I invite you to click/scan the QR code below to join as a “member” or to buy a coffee or two (or five) and support this effort.