
Weekly Economic Update 03-13-25: Consumer Debt; Small Business Optimism; Consumer Price Index; and Producer Price Index
Amidst uncertainty and chaos, inflation takes a pause...unless you like eggs.
The views and opinions expressed in this post are solely those of the author and do not necessarily reflect the views of the Georgia Institute of Technology or the Georgia Board of Regents.
“May you live in interesting times” is an English expression of what is supposedly a Chinese curse. However, there is no known Chinese source, and there appears to be no such expression in Chinese. The closest related Chinese expression translates to "better to be a dog in times of tranquility than a human in times of chaos."
I have two dogs, and they live a pretty good life. With my kids grown and out of the house, these dogs have become the focus of my daily affection and they get pretty much whatever they want - they lay around on the couch all day, get plenty of food and treats, play in a huge fenced in yard whenever they want, and get walked around the neighborhood to meet up with all the other spoiled rotten dogs in the subdivision.
And I don’t think they have once been concerned about tariffs, DOGE, the stock market, the war in Ukraine, or whether or not Greenland wants to join the U.S.
But for us humans, the chaos can be unsettling and has recently been financially troublesome. Taking a look at the stock market alone, the first year of Trump’s first term, the market was up about 20%. And while it is still early, there is some ground to make up, with the market now down 5% from the beginning of the year and 10% from just one month ago.

I do think that there are a lot of upcoming positive impacts from the new administration’s policies that have not been priced into this market (e.g., lower regulation, tax cuts, lower energy costs, etc.), but for now, the level of uncertainty and chaos is winning the day.
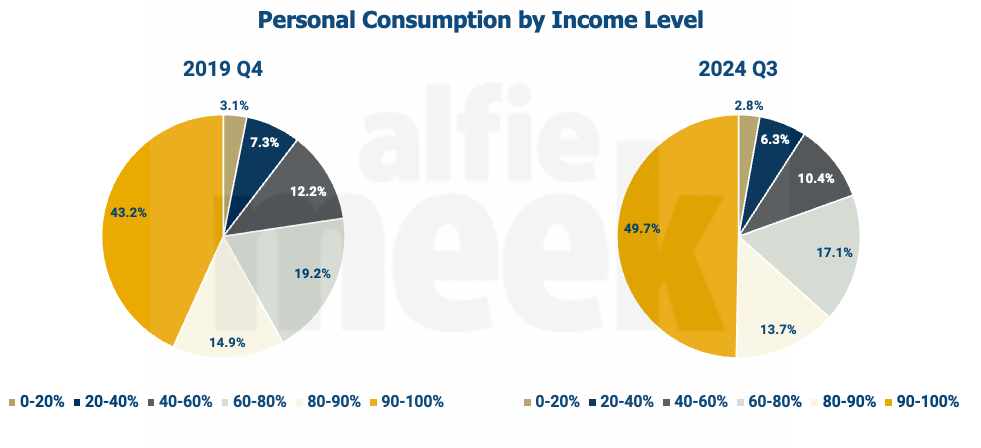
Why does this matter? It matters because the high-end consumer is who is driving the economy. Recall that in the fourth quarter, consumer spending was responsible for more than 100% of GDP growth. If we look at personal consumption by income, it is the high-end consumer that doing all the spending. Pre-COVID, the top 10% of earners represented 43% of personal consumption. That has risen to 50%. That might not seem like a lot, but it is. The top 10% represent a larger percentage of a larger pie.
That consumption is being driven by the “wealth effect,” and that wealth effect is being driven by two things - real estate and the stock market. With real estate price growth slowing, the stock market becomes the main driver of that wealth effect. A drop of 10+% will have a psychological impact on the high-end consumer, and if the high-end consumer stops spending…the game is up.
But don’t worry, the good news is that the GOP-lead House just passed yet another “continuing resolution” for the rest of FY 2025 and chose not to cut a single dollar of spending. (So much for fiscal conservatism.)
Consumer Debt
Since consumer spending is the primary driver of the economy, the level of consumer debt is of interest. In January, outstanding total consumer debt rose $18.1 billion and is now back above $5 trillion (full release here).

Something really strange in going on with the consumer credit data. Below is hte chart I shared last month. Notice how the December level of credit jumped $40 billion, and revolving credit was up over $20 billion.
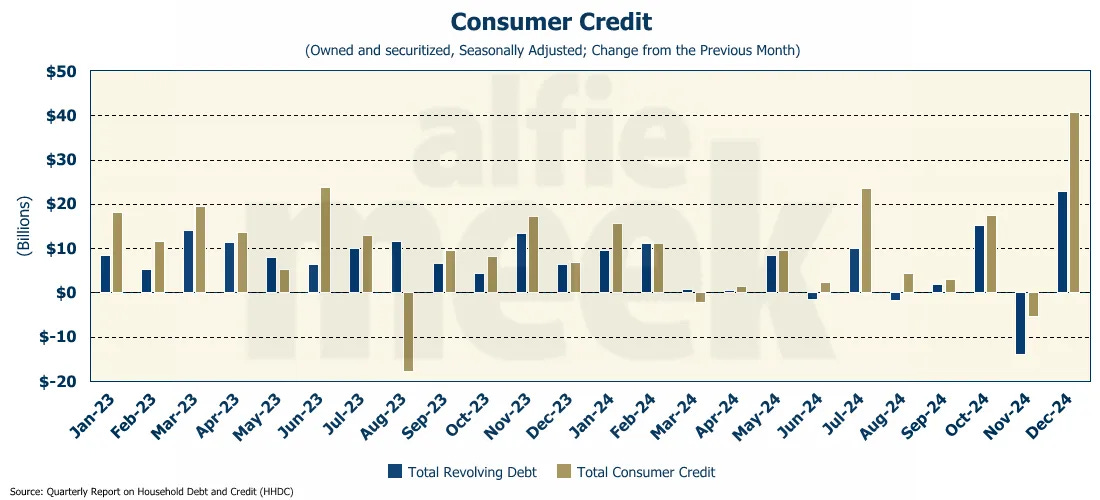
Now look at the same chart from this week for the January data. Notice the December numbers. Rather than showing an increase of $40 billion in total credit, the Federal Reserve is now reporting a DECREASE of $100 billion in December - a swing of $140 billion in the opposite direction. The same thing holds true for revolving credit…from $20 million up to $34 million down! That is one heck of a revision! How in the world are we supposed to do any analysis when the data swings so dramatically? And who is in charge of collecting consumer debt data for the Fed?

For now, let’s put this data disaster aside because I can’t comment on or analyze this madness.
I mentioned earlier that it was the top 10% of income earners that were doing all the spending and keeping the economy afloat. The fact of the matter is that the current economy is significantly more favorable for the top 50% of the income distribution than for the bottom 50%. Take for example, auto loan delinquencies. The share of subprime car borrowers at least 60 days past due on their loans hit 6.6% in January, the highest level ever recorded, and DOUBLE the rate from just 3 1/2 years ago. At the same time, prime auto loan delinquencies are running less than 0.4%. We are truly experiencing two very different economies - the top 10% are doing well, but the bottom half has been in recession for a while.

Small Business Optimism Index
Early in the week, we got the latest read on small business optimism, and while it is still above 100, it has fallen back from where it was post-election (full release here). Just 12% of small businesses reported that it is a good time to expand their business, down five points from January. This is the single largest monthly decrease since April 2020 when we shut the economy down for COVID!

Not surprisingly, business uncertainty has exploded in the last two months and is now at the second-highest level in the survey’s history, surpassed only by the level of uncertainty small businesses felt the month before the election

Lastly, another theme showing up in a lot of data recently has shown up here as well…price increases. The net percent of owners raising average selling prices rose sharply in February to a net 32%. This is the largest monthly increase since April 2021, and the third highest in the survey’s history. As I continue to point out, with or without tariffs, inflation is coming back.

Consumer Price Index
Or is it? With just about every single bit of data pointing to higher inflation, the February CPI came in with a surprise reading that was lower than expectations (full release here). Both CPI and core CPI came in at 0.2% for the month, which represented annual growth of 2.8% and 3.1% respectively - both slightly lower than expectations. “Super core CPI” (services less shelter) also fell to its slowest rate since October 2023.
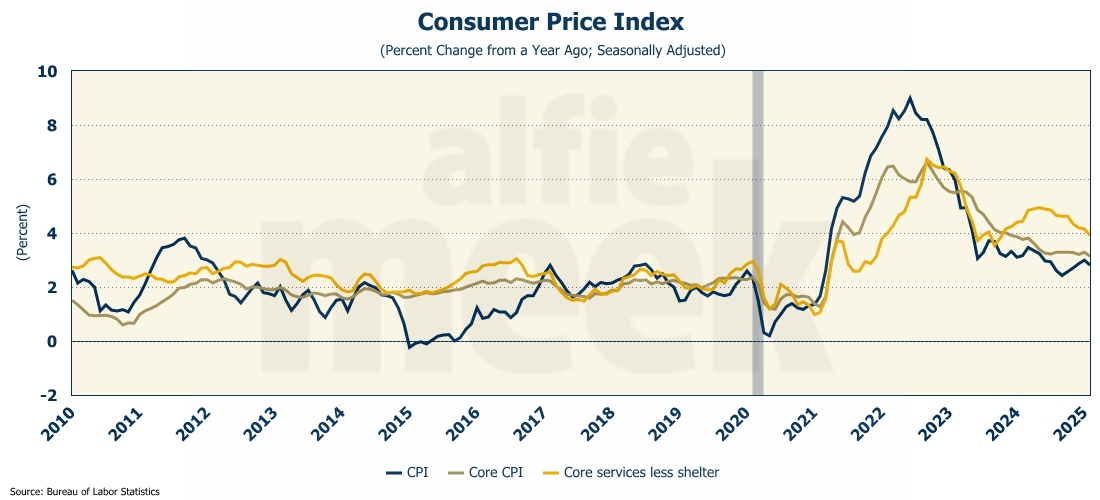
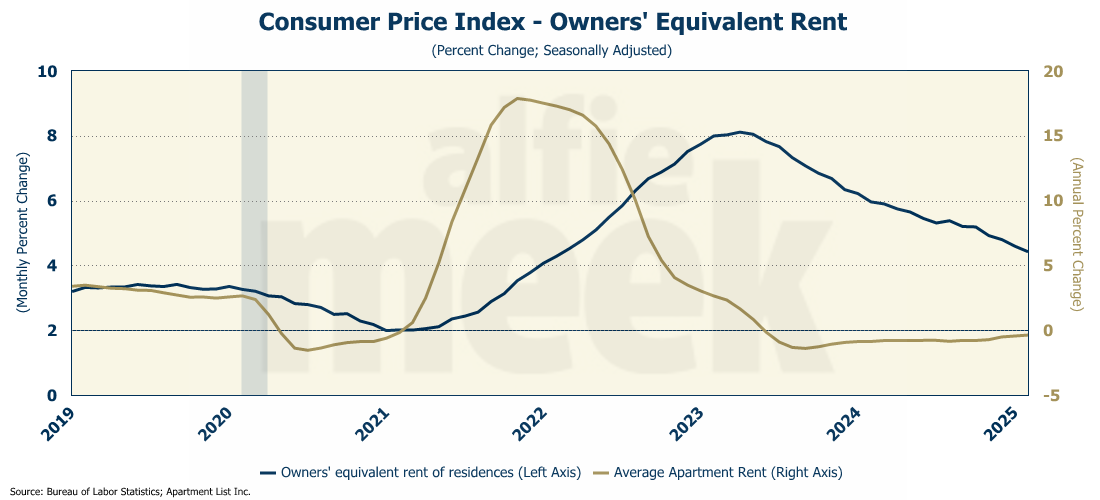
The CPI for shelter rose 0.3% in February, accounting for nearly half of the monthly increase in the total index. Owners’ equivalent rent continues to slow and is now running 4.4% on an annual basis. The average apartment rent is declining and has been since mid-2023, but looks to be about to stabilize.
One final note on CPI…for some strange reason, the price of eggs has captured our national consciousness as the ultimate measure of inflationary pressure and Presidential policy effectiveness. Strange, given that the increase in the price of eggs has just about nothing to do with monetary growth and everything to do with the slaughter of more than 150 million chickens, turkeys, and other birds as a result of the current bird flu outbreak, with the vast majority of them being egg-laying chickens. But who cares about facts when you can cudgel your political enemies with a statistic that the general public doesn’t understand but has to face every single day? So, since it seems to be in vogue, I will report that egg inflation slowed in February, but still grew at a monthly rate of 10.4%

Producer Price Index
On Thursday morning we got the latest read on the Producer Price Index (PPI) and like CPI, it came in lower than expected. In fact, it didn’t go up at all coming in at 0.0% for February (full release here). On an annual basis, PPI is running 3.2%.

Core PPI actually dropped by 0.1% - the largest monthly decline since the economy shut down for COVID. Expectations had been for an increase of 0.3%. On an annual basis, core PPI is running 3.4%.
The PPI for goods however, rose by 0.3%. Interestingly, two-thirds of was attributable to prices for chicken eggs, which jumped 53.6 percent.

Both the CPI and PPI numbers fly in the face of all the other recent data we have gotten from the manufacturing sector, the service sector, and small businesses. It remains to be seen if this is just a pause, or if inflation is slowing….and if the latter, is to due to policy or a recession? The next few months will certainly be interesting as there are deflationary pressures building including the falling price of oil and a weakening labor market.
But wait…I thought tariffs were supposed to INCREASE inflation? As I have recently pointed out, maybe not.
One More Thing…
Finally this week, I want to thank all my “bronze” level members who subscribe for just $8/month. Dave Gmeiner, Steve Goins, Colin Martin, Brad Wood, Tommy Jennings, Carlos Alvarez, Chad Teague, Andrew Imig, Adam Hayes, Kimble Carter, and someone with a “GTwreck” e-mail! Thanks for all your support!
I also have a few supporters who have chosen the monthly option - Rope Roberts, William Whitlock, and Sarah Jacobs. Thank you all for your monthly support!
As I do each week, I want to invite you to join this group and click/scan the QR code below to join or just “buy some coffee” in support of this weekly update.

I am looking forward to my next big presentation at the Partnership Gwinnett Economic Outlook on March 27th. I hope to see many of you there!