Weekly Economic Update 05-02-25: Case-Shiller Home Prices; Consumer Confidence; JOLTS; Personal Income & Spending; PCE Inflation; and First Quarter GDP
Consumers fear tariff-induced inflation, but it isn't showing up in the numbers. And they just keep on spending.
The views and opinions expressed in this post are solely those of the author and do not necessarily reflect the views of the Georgia Institute of Technology or the Georgia Board of Regents.
Ever since I began my career as a professional economist in 1991 (and no doubt long before), something has occurred on the first Friday of every month. The Bureau of Labor Statistics (BLS) has released the employment data for the previous month. It is arguably one of the most important data releases each month, and since I began this blog, I have consistently commented on the employment data in the first post of the month.
Until today.
The April employment data was released this morning. However, I had to finish writing and post this column on Thursday night. The reason is that, as this goes out at 9:30 am, I will be at Georgia Tech watching my youngest son graduate. And, as a faculty member of that prestigious institution, I will also be sitting on the stage with other distinguished faculty as he walks across and is awarded his degree.
The employment data will have to wait until next week.
Case-Shiller Home Price Index
Home prices just keep on rising. According to the latest data from Case-Shiller, home prices in the U.S. hit another record high in February, rising 0.4% over January and 3.9% over the past 12 months (full release here). For the 20 largest metro areas, prices are up 4.5% over last year.

Looking at the 20 large metro markets, only Tampa experienced a drop in home prices, which are now 1.5% below where they were in February 2024.

Consumer Confidence
According to the Conference Board’s gauge of consumers, confidence in the economy fell to a 5-year low in April, mostly due to the uncertainty surrounding tariffs and how they may impact the economy (full release here). This was the fifth consecutive monthly decline, the longest consecutive monthly decline stretch since 2008.

Unlike the University of Michigan, the Conference Board doesn’t break its data down by political party. However, we can compare “red” states with “blue” states. While “red” states are posting a higher level of confidence than “blue” states, the sharp decline in confidence is clear across the board.

Finally, according to the survey, consumers’ expectations about inflation 12 months out shot up in April to 7% - the highest since late 2022, when the U.S. was actually experiencing a high rate of inflation. However, as you can see from the graph below, the Conference Board’s survey population is always very pessimistic with respect to their inflation outlook, consistently running 2%-3% higher than actual, or frankly, any other survey, including the University of Michigan.

Of course, as we recently pointed out, the University of Michigan survey is also off the charts right now…mostly due to the political bias in their survey. It is interesting to note that the NY Fed survey is much more realistic and currently sits at only 3.6% - roughly half the rate reflected by the Conference Board survey.
Ironically, prices could be significantly higher a year from now, but if so, it will have nothing to do with tariffs and everything to do with monetary policy. As Milton Friedman famously said, inflation is everywhere and always a monetary phenomenon. Too many people today conflate inflation with an increase in prices, and they are two very different things. Inflation of the money supply causes a rise in prices, but not all rises in prices are caused by inflation. Prices can also rise due to a hurricane, a war in Eastern Europe, an explosion at a factory, or the killing of 150 million chickens due to bird flu. But that is a level of nuance that is lost on most people. Economic ignorance is a real thing.
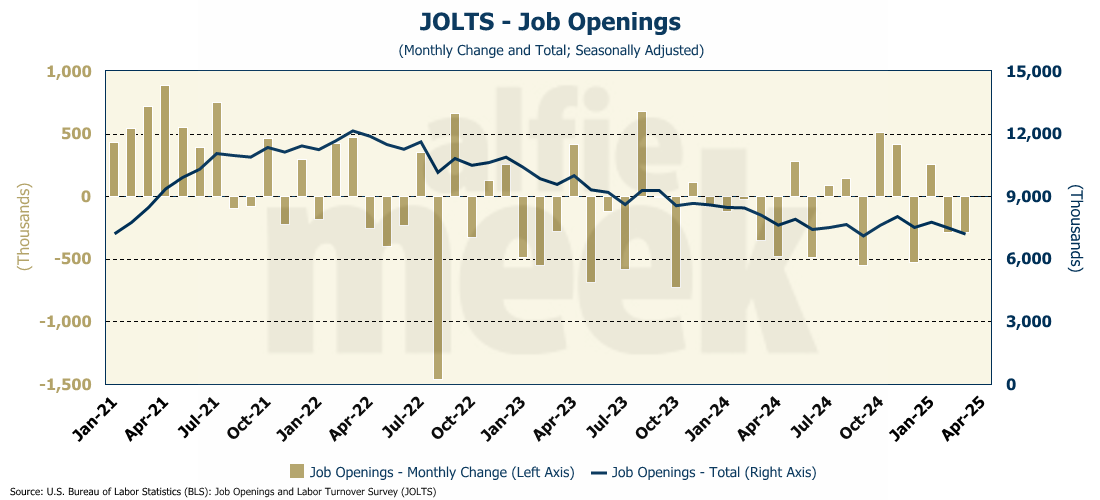
Job Openings and Labor Turnover Survey (JOLTS)
The most recent JOLTS report from the BLS revealed that in March, the labor market continued to weaken as the number of job openings continued to decline, falling 288K to 7.192 million - the lowest since last September (full release here).
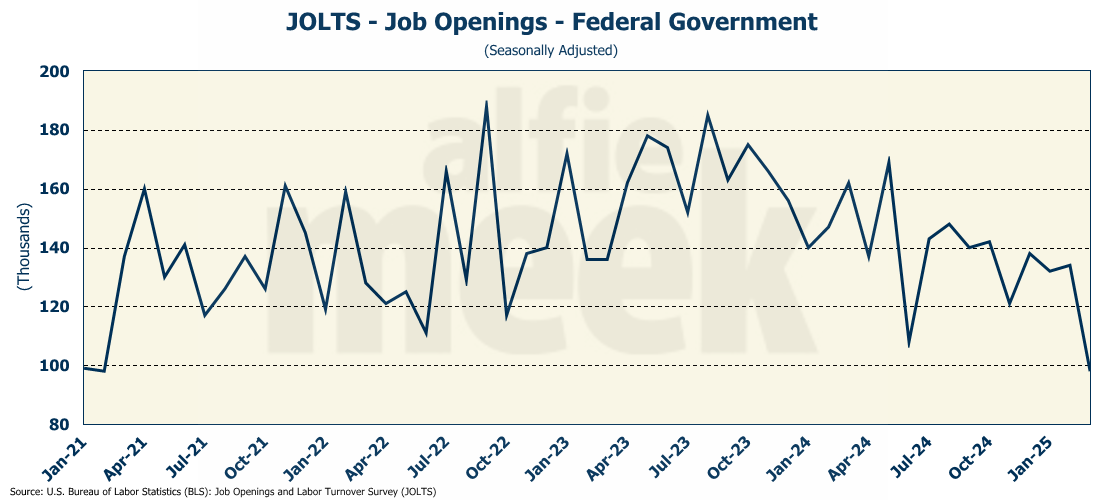
Not surprisingly, government job openings fell to their lowest level in five years, with federal government employment posting only 98K openings…the first time that number has been below 100K since COVID. Even though I won’t be reporting on it this week, I won’t be surprised if the jobs report on Friday shows a significant drop in government employment.
Even with this decline, the number of job openings is still more than the number of unemployed workers, although that difference fell to the lowest level since the COVID crash. However, until this difference turns negative, it is hard to make the case that the labor market is demand-constrained. There has never been a recession that began in a period where there were more job openings than unemployed workers.

However, even with the drop in the number of job openings, it is hard to make the case that the labor market is significantly weakening when the number of new hires is rising. New hires actually ticked up in March to 5.411 million, the highest since September.

Further, the quit rate - a measure of confidence people have in finding a better-paying job elsewhere - continues to rise from a low set back in November.
Perhaps the labor market is not as weak as many people seem to think.
Personal Income & Spending
Not only do people seem to be finding jobs, but they also continue to spend money. Despite all the “economic uncertainty;” despite all the tariffs; despite all the credit card debt; despite the declines in the stock market, personal consumption jumped 0.7% in March (full release here). Unfortunately, personal income only rose 0.5%, pushing the savings rate down to 3.9%.

Of course, the story is that Americans ran out and made a bunch of purchases, moving future spending into the current period, to avoid those nasty tariffs. If that is true, 1) I would have expected an even bigger number, and 2) we should see a slowdown in personal consumption in the coming months.
Anyone want to bet on the American consumer slowing down their spending?
PCE Inflation
So, Americans went out and spent money in March, and the prices for the things they bought were actually lower! Personal consumption expenditure (PCE) inflation for March FELL slightly from February, dropping 0.045%. That is the biggest monthly drop since COVID (full release here). That brought the year-over-year number down to 2.2%.
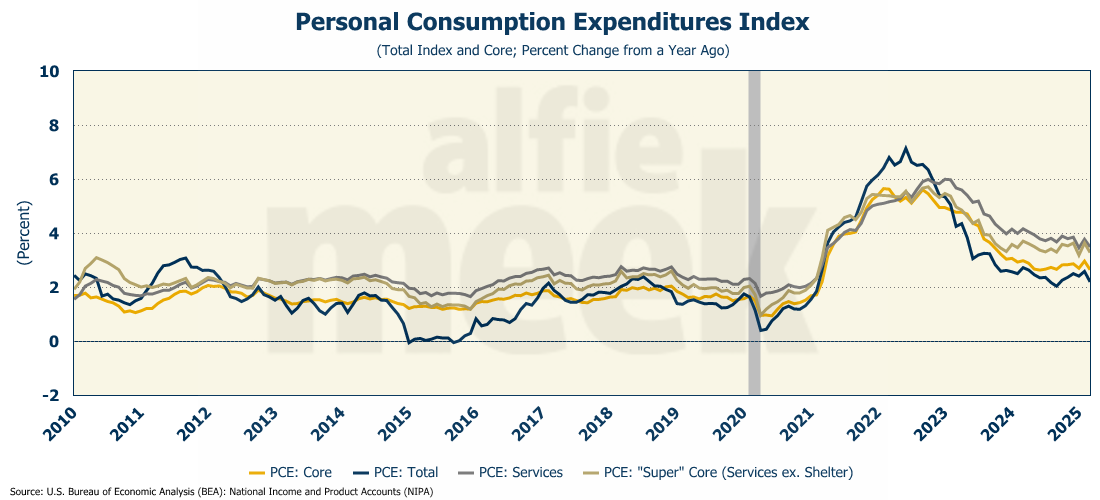
The Fed’s preferred measure of inflation, core PCE (PCE less food and energy), was also flat and is now running at 2.6% year-over-year - the lowest since 2021.
To be clear, the economy actually experienced DEFLATION in March. But wait!?! I thought tariffs were supposed to spur some enormous amount of scary inflation? The people who complete the surveys for the Conference Board and the University of Michigan certainly think so. And so do most of the talking heads on TV.
Like I said before, economic ignorance is a very real thing.
Gross Domestic Product - First Quarter 2025 (Advance Estimate)
Finally, this week, we got the first look at GDP for the first full quarter of the new Trump Administration. And it wasn’t good. According to the Bureau of Economic Analysis (BEA) the economy contracted slightly (-0.3%) in the first quarter. Expectations were for a slight increase of 0.3% (full release here). This is the first decline in GDP since the -1.0% drop in the first quarter of 2022. However, the almighty arbiters of what is and isn’t a recession at the National Bureau of Economic Research (NBER) didn’t think the -1.0% decline in 2022 was a recession, so there is no reason to think they will call this a recession either.
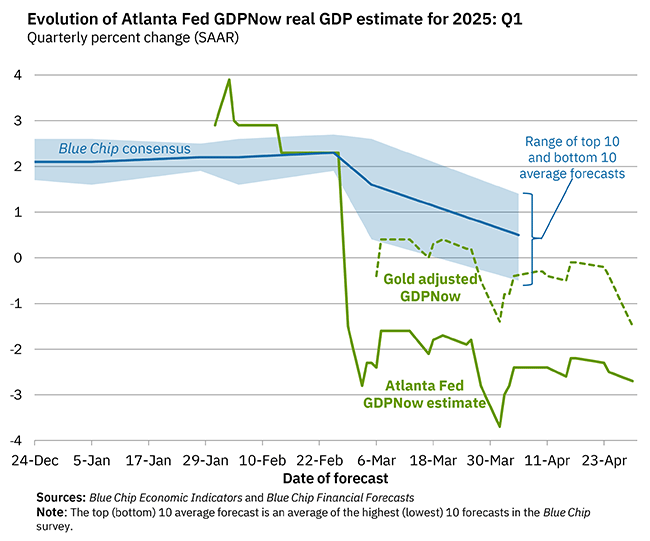
This -0.3% was far better than the absurd -2.7% prediction of the Atlanta Fed’s GDPNow model, which has just gone completely off the rails.
Even with the bad report, there is some lipstick you can put on this pig. For one, if you strip out the two negative components - government and net exports - the number was actually fairly strong. Personal consumption grew at an annualized rate of 1.8%. Non-residential fixed investment grew at an annual rate of 9.8% - the fastest it has grown since the second quarter of 2023, reflecting the explosion of data centers. Even residential fixed investment posted a small gain despite the slowing housing market and rising rates.

However, as you can see from the graph above, net exports PLUNGED. The import of goods exploded to an annualized rate of 50.6% as people and businesses rushed to make their purchases before any tariffs went into effect. Excluding the bounce-back quarter from COVID (Q3 2020), the annualized growth rate was the highest rate of import growth since 1974. Going forward, this number will reverse, and net exports will be a net positive to the GDP calculation. (As a side note, the import of gold represented about half the import number. Somebody is still clearly concerned about inflation.)
Lastly, for the first time in three years, government expenditures were a negative in the GDP calculation. We can expect that to continue for the next few quarters…and with a $36 trillion debt, that isn’t necessarily a bad thing.
What is a “bad thing” is that this number may give the Fed an opening to justify a rate cut later this summer. And that would be a huge mistake.
One More Thing…
As always, on the first post of the month, I like to recognize my gold and silver members. Special thanks to my two “gold” level members, Andrew Hajduk and Beth Truelove, with the White County Chamber. In addition, I would like to thank my “silver” level members, Dan McRae, Chuck Fitch, and Greg Whitlock. The regular support of these members will help offset the cost of maintaining access to the data providers that allow me to produce this analysis.
If you are a regular reader and find this useful, please consider a membership. I invite you to click/scan the QR code below to join or just “buy a coffee!”