Weekly Economic Update 06-27-25: Existing Home Sales; Case-Shiller Home Prices; New Home Sales; Consumer Confidence; Durable Goods; Personal Income; PCE Inflation; and Final First Quarter GDP
The data this week shows that the consumer is in rough shape and inflation is rising.
The views and opinions expressed in this post are solely those of the author and do not necessarily reflect the views of the Georgia Institute of Technology or the Georgia Board of Regents.
Last week, the Federal Reserve met to contemplate the economy and interest rate policy. Likely absent from those discussions was any acknowledgement of their own raging incompetence.
They admitted what I have been saying for more than a year now - that inflation is not beaten, and is likely to come back and be higher by the end of the year. However, rather than admit that future inflation is due to the fact that the money supply is currently growing at a greater than 9% annualized rate, they want to blame “tariffs.” In fact, the word “tariff” was mentioned no fewer than 30 times in Chair Powell’s comments on Wednesday afternoon. Growth in the money supply was not mentioned once.
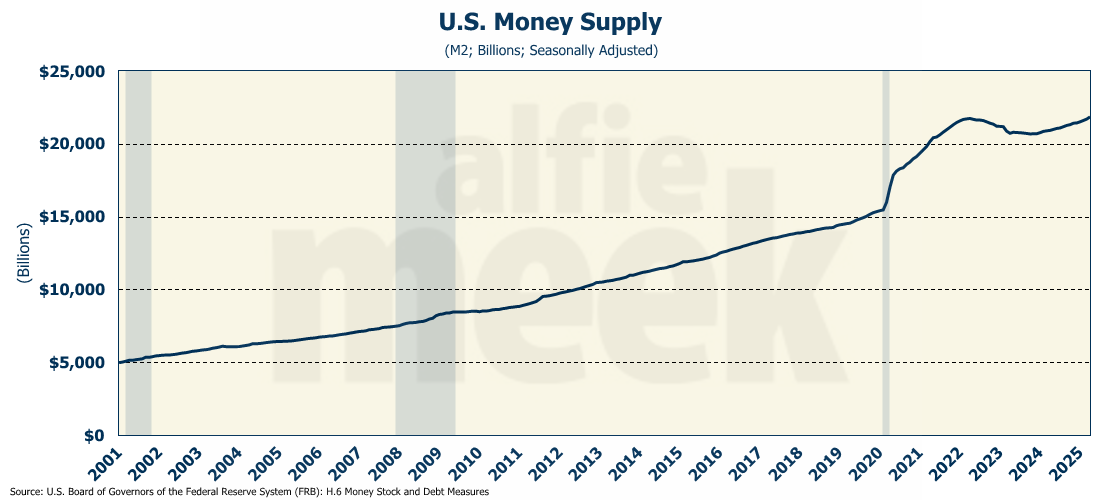
The quantity of money is now in excess of the record-setting level that we experienced during COVID, which led to 9% inflation in 2022. As Nobel Laureate Milton Friedman famously pointed out, “inflation is always and everywhere a monetary phenomenon. It is made or stopped by the central bank.” If I were Chair Powell, I wouldn’t expect the Nobel committee to be calling anytime soon. Tariffs are simply a convenient scapegoat to hide the Fed’s abysmal policy track record.
Another interesting fact that came out of last week’s meeting is that seven members of the committee see ZERO rate cuts in 2025. That is up from four who held that position six weeks ago. Those who have been reading me for a while, or heard my economic outlook at the beginning of the year, know that I have been saying this for months. You can’t cut rates in the face of impending inflation, regardless of how bad the housing market is, or how many cute, insulting nicknames the President makes up for you. In fact, if they were honest, they would be raising rates. But that is a non-starter as well. Simply, they are in a pickle…one of their own making. I have no sympathy.
Existing Home Sales
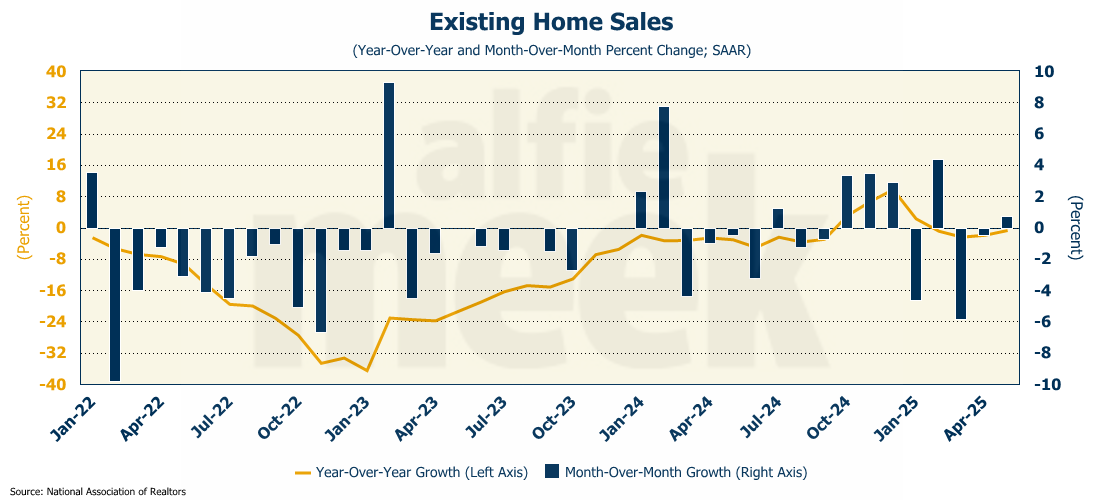
Speaking of interest rates…existing home sales rose slightly in May, growing at only 0.7% (full release here). That is the weakest May reading since 2009, and the second worst May EVER. On an annual basis, existing home sales are down 0.8% from one year ago. May was the fourth consecutive month of year-over-year declines.
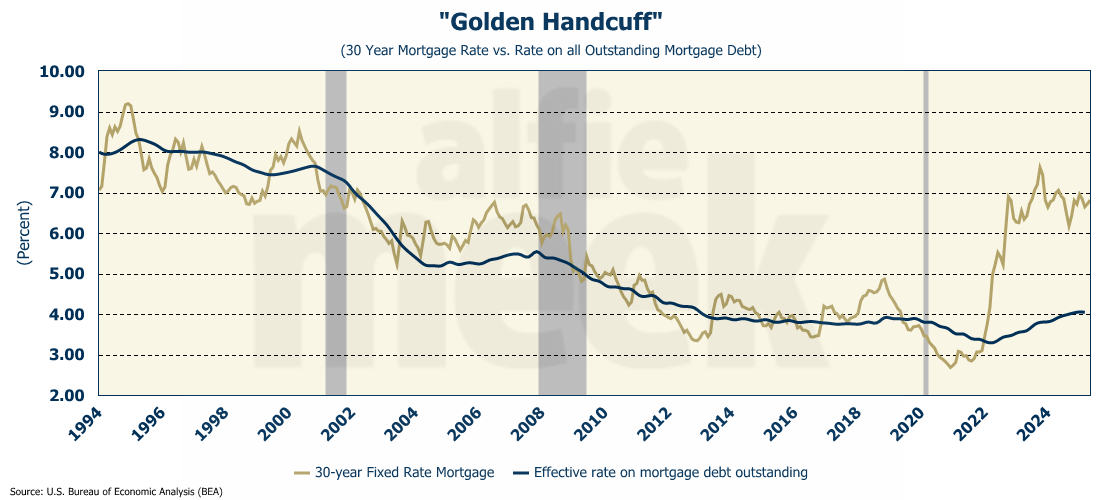
Obviously, high mortgage rates remain the primary reason that existing homeowners are reluctant to sell and lose their low existing rate. The gap between all existing mortgages and current rates is still nearly 300 basis points…a historically wide margin.
The median sales price of existing homes is up 1.3% over last year and now stands at nearly $423K, which is the highest May price on record. Prices are up 51% from the start of the COVID pandemic only five years ago.
First-time home buyers continue to gain entry into this market as they made up on 30% of closings in May. In addition, houses over $1 million are no longer outperforming the overall market.
New Home Sales
While existing home sales were up slightly, sales of new homes plunged 13.7% in May - the largest monthly drop since mid-2022 (full release here). However, that didn’t impact the median price, which rose to $429,300 - 2.9% higher than last May.
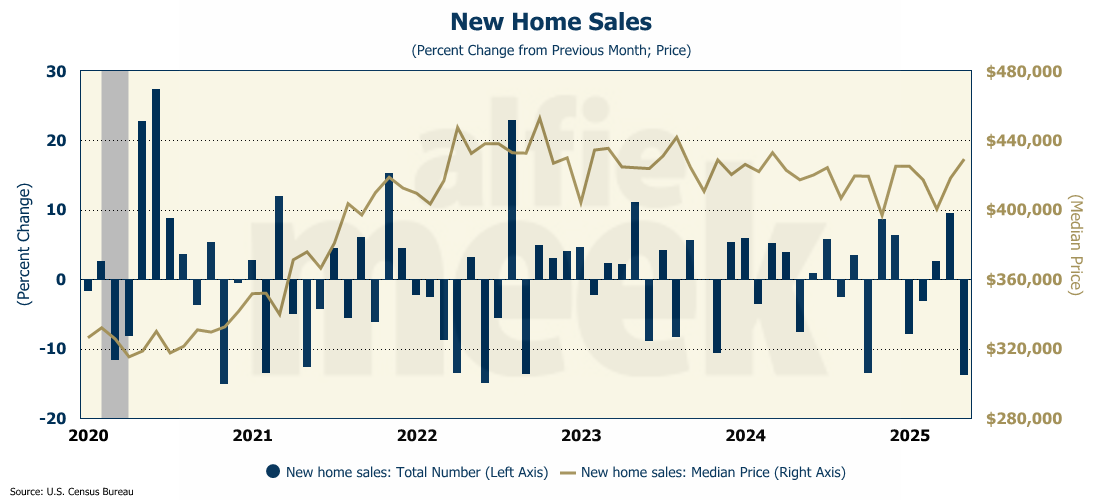
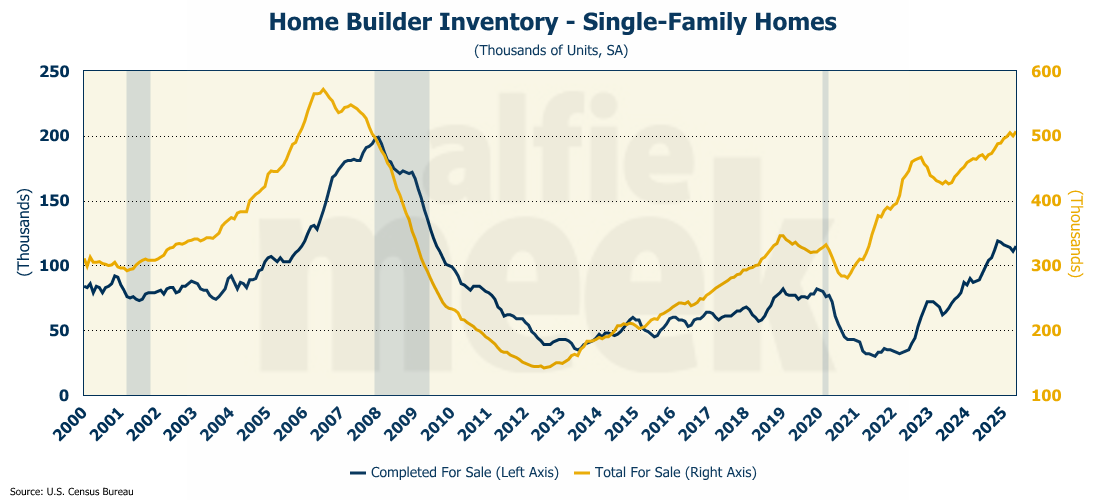
We saw last week that builders aren’t starting many new homes. One reason may be that they have so many to sell! The inventory of new homes for sale rose to 507K units, which is the highest level of inventory since 2007! Roughly 115K of those are completed, a slight increase over last month. With so much inventory, there is certainly no reason to build more, and a lot of pressure to start lowering prices.
Case-Shiller Home Price Index
The most recent data from Case-Shiller confirms that nationally, overall home prices are still up 3.4% from one year ago. However, on a month-over-month basis, April saw the second consecutive monthly decline. (Remember that Case-Shiller data lags by a couple of months.). Month-over-month, home prices fell 0.3%, the largest drop since December 2022 (full release here). Prices in the 20 largest metro areas also fell for the second consecutive month. Tampa has been experiencing declines for the past six months, but in April, they were joined by Dallas, which posted an annual decline of 0.3%.
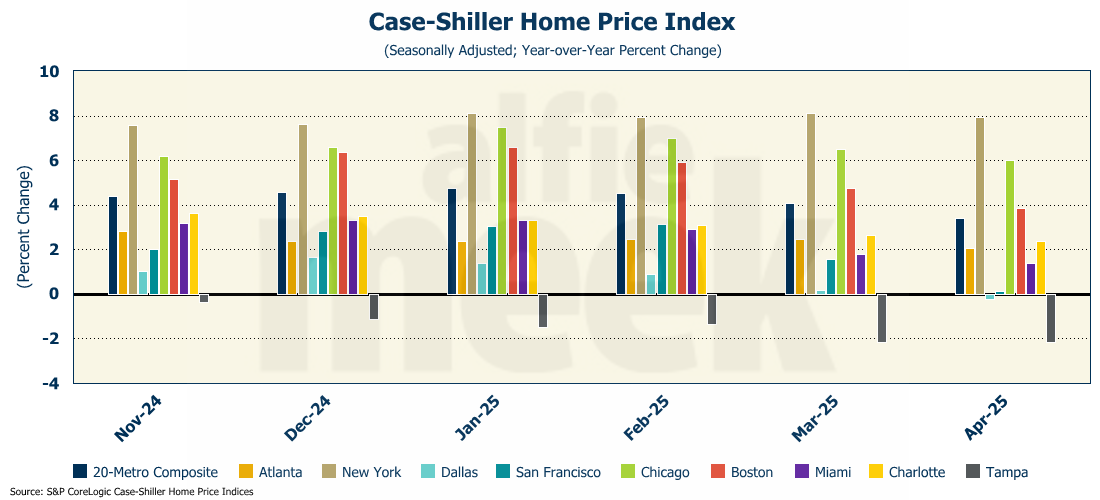
Home price appreciation is clearly slowing, and without any significant drop in mortgage rates, prices may begin to pull back across the board later in the year.
Consumer Confidence
After last month’s surprise jump in confidence, expert opinion was that the rebound would continue into June. However, it appears that consumers soured just a bit on the economy in June, with both confidence in the present and the future falling back from May’s short-lived enthusiasm (full release here).
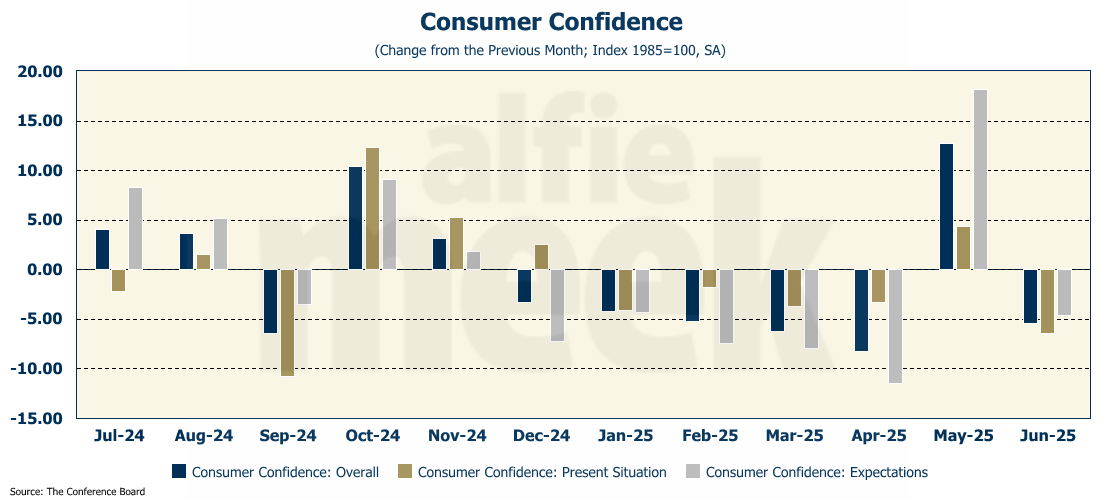
May had certainly been the exception, as consumer confidence has been steadily falling since the November election. All three indices are well below their pre-COVID level, and confidence in the present situation fell to the lowest level since September 2024.

First Quarter GDP (Final Estimate)
The final estimate of first quarter GDP was released on Thursday, and surprisingly, it was revised down, quite considerably, to -0.5% (full release here). The advanced estimate back in April was -0.4%, then revised in May to only -0.2%, and now finally moving farther in the other direction to -0.5%. That is quite an unusual pattern for GDP revisions.
Earlier this week, I was telling a friend that I didn’t expect the final revision to be very much at all. Boy, was I wrong! The revision was primarily due to downward revisions to consumer spending, which posted only a 0.5% annualized growth rate in the first quarter - the slowest rate since the COVID lockdowns.
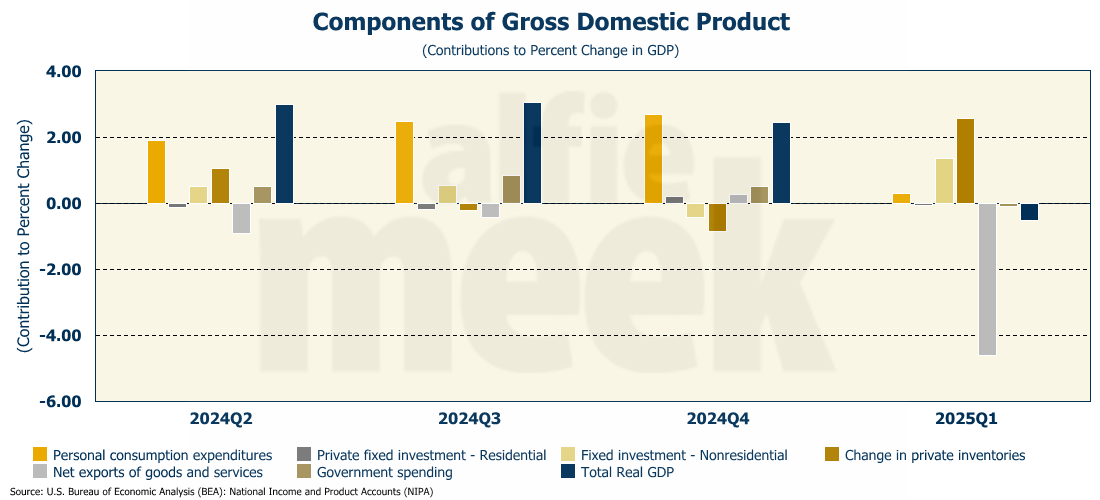
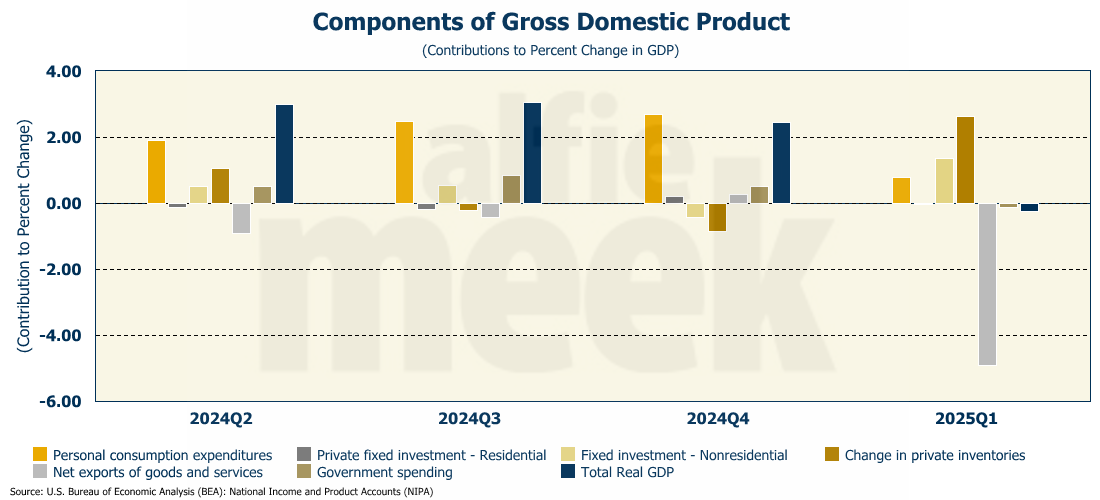
Compare the chart above with the same chart from last month (below), and you can see the extent to which personal consumption expenditures fell off with very little change in any of the other components. Given what we know about the financial condition of the U.S. consumer (and the falling confidence they expressed in the first quarter), the downward revision for the first quarter makes a lot of sense. They kept the entire economy afloat in the fourth quarter of last year (again, refer to the graphs), but with stubbornly high interest rates and growing debt defaults, the average consumer is tapped out.
Although the consumer is tapped out, personal consumption was still positive in the first quarter. The negative GDP was driven by the front-loading of imports, which will rebound in the second quarter. Even with weak consumer spending, the second quarter GDP should be in excess of 3%.
Personal Income & Consumption
On the heels of the revised first-quarter personal consumption data, this morning we got data on May personal consumption and income. Expectations were that personal income would rise 0.3% following the strong performance of the past three months. What we got instead was a DECLINE of 0.4% (full release here). That is the first monthly drop in income in nearly 4 years. Disposable personal income dropped even more, falling 0.6%.
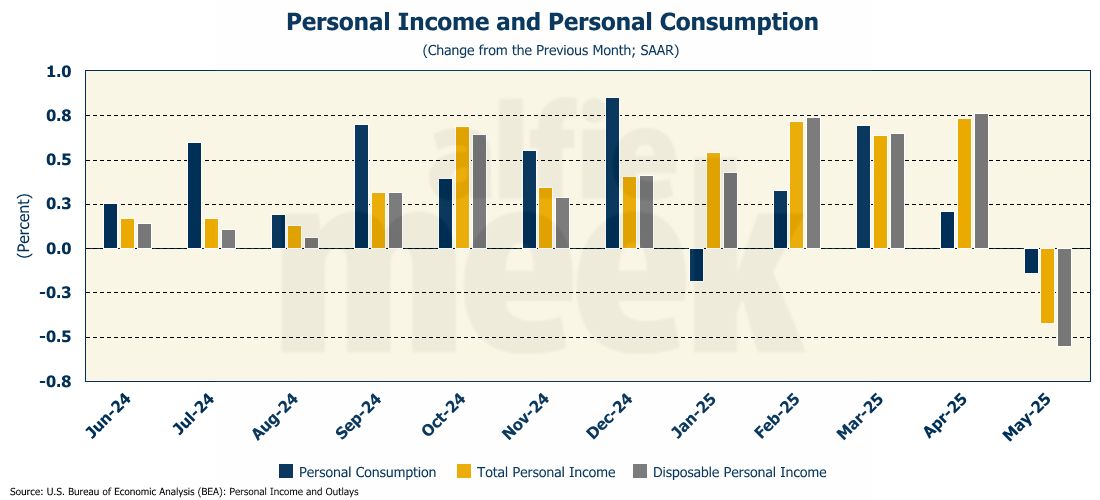
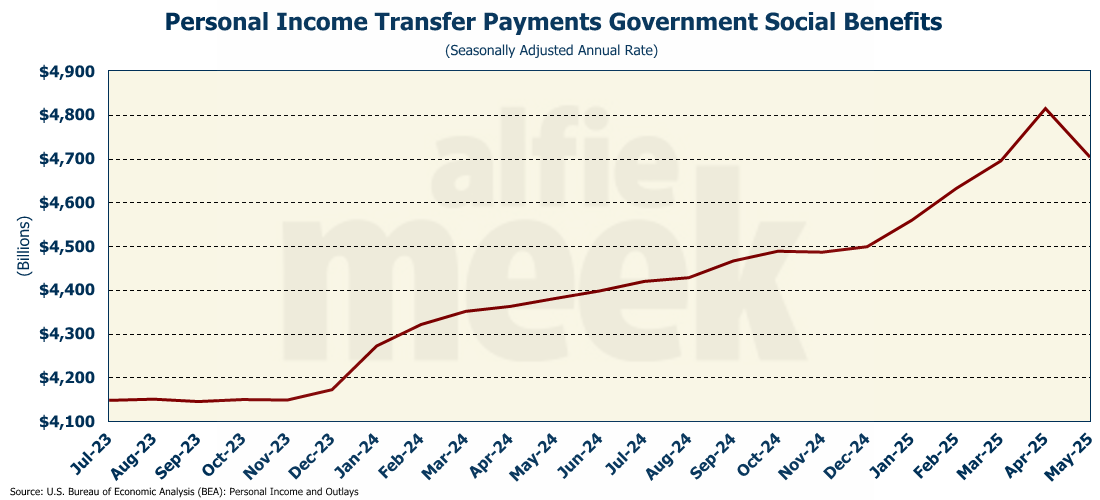
One of the drivers of the decline in personal income was the plunge in government transfer payments, which fell sharply in May, driven in large part by a drop in social security benefit payments, which were cut when DOGE eliminated payments to 'dead' or ‘unbelievably old’ people. It is the first time transfer payments have fallen since COVID.
Not surprisingly, with incomes falling off, consumption did as well. Personal consumption dropped 0.1% in May. Because income dropped more than consumption, the saving rate fell to 4.5%.
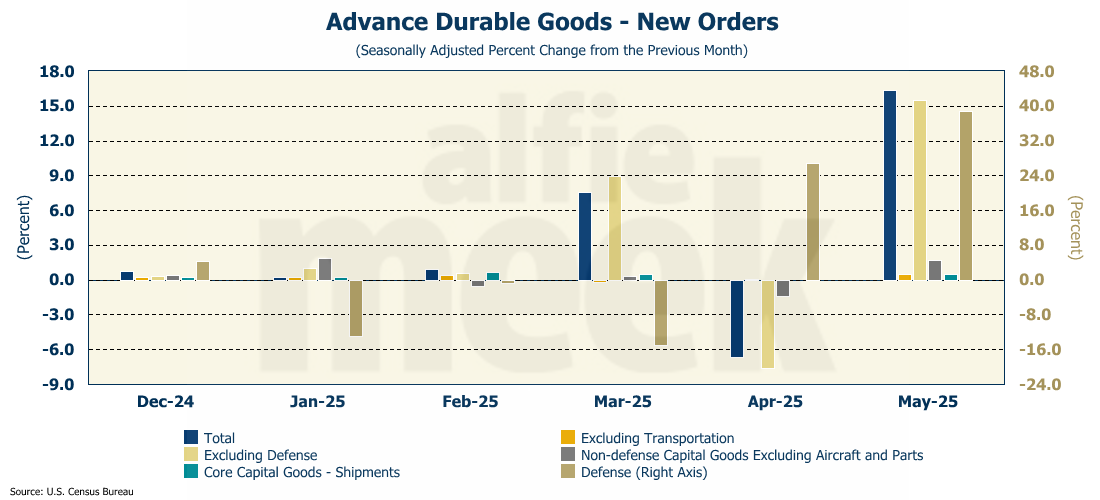
Durable Goods
You may recall that back in May, the President had a four-day Middle East tour designed to boost investment in the United States. Well, it certainly didn’t take long for that visit to have an impact. New orders for durable goods rose 16.4% in May, the biggest monthly increase since July 2014! And virtually all of it was due to non-defense aircraft orders, which were up 230% for the month. If you exclude aircraft, the growth was only 1.7%, but even that was better than expected. Core capital goods shipments also grew better than expected, coming in at 0.5%, which supports the theory of a strong second-quarter GDP.
PCE Inflation
Finally, this week, we got the Personal Consumption Expenditure (PCE) measure of inflation. And surprise, surprise, PCE inflation jumped from 2.1% in April to 2.3% in May. The Fed’s “favorite measure” of inflation - core PCE - also came in hotter than expected, rising 0.2% bringing it up to 2.7% year-over-year. Maybe printing money at a 9% annual rate isn’t a great idea.
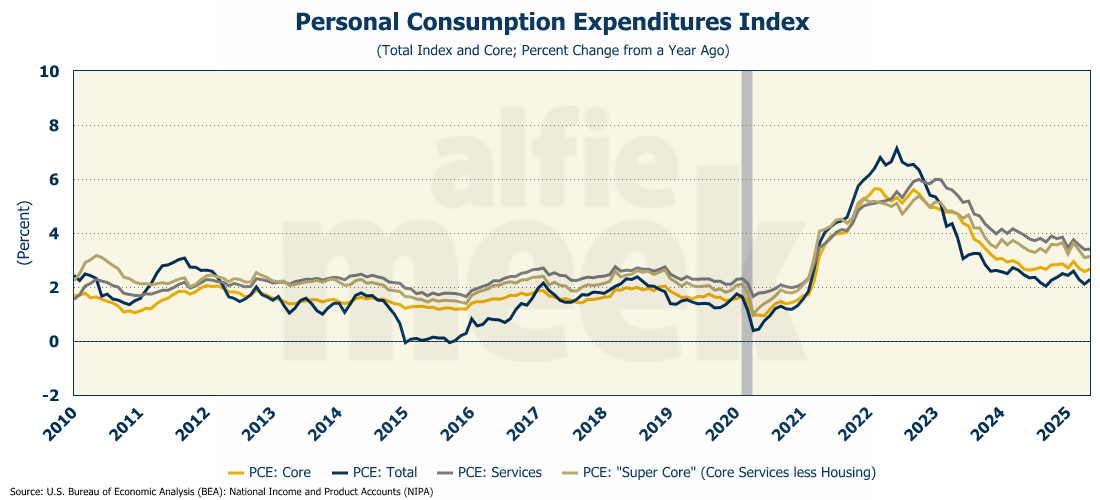
The Fed's favorite inflation indicator - Core PCE - also came in hotter than expected in May, rising 0.2% for the month, and 2.7% over last year.
One More Thing…
I want to thank the accounting and advisory firm, Warren Averett, for having me out to Birmingham last week to speak at their Accounting Trends professional education session. I always enjoy talking about the economy, and based on several attendee comments, it seems my talk was well received. Several of the participants also signed up for this weekly update, so welcome to all of you!
As I mentioned, sometime by the end of the year, I will be moving this update to a paid-subscription model. Part of it will still be free, but only paid subscribers will get the whole thing. In the coming weeks, I will be sending e-mails to my subscribers to talk about how I plan to make the transition back to the SubStack platform for payments. However, until then, if you find this weekly update worthwhile and informative, I invite you to click/scan the QR code below to join as a “member” or to buy a coffee or two (or five) and support this effort.