
Weekly Economic Update 2-14-25: CPI; PPI; Small Business Confidence; Retail Sales; Industrial Production & Capacity Utilization; and More Thoughts on the January Employment Report
Inflation is accelerating but consumers keep on spending
The views and opinions expressed in this post are solely those of the author and do not necessarily reflect the views of the Georgia Institute of Technology or the Georgia Board of Regents.
Happy Valentine’s Day! (Yes…that’s today. You’re welcome for the reminder.)
According to WalletHub, Americans will spend $27.5 billion on Valentine’s Day this year, or nearly $200 per person celebrating. That makes the day the third most expensive holiday on the calendar. About $6.5 billion will be spent on jewelry while another $5.4 billion will be spent on an “evening out,” including dining and entertainment. According to the same survey, 39% of Americans say that inflation will impact how much they spend on their sweetheart, and 29% say they will buy their gift at a discount store. (But yea, the economy is “strong.”)
Surprisingly, 34% don’t expect their Valentine to spend any money on a gift this year. If I may offer a piece of advice to the men out there…do NOT take the chance that your Valentine is in that group. I don’t care what she says…take it from someone who has been happily married for 32 years, get a gift.
Another interesting statistic is that online dating increases by 33% between February 1st and February 14th. Which is interesting…it would seem that perhaps that might be the time to call it off and save a little money…not start something new. But I guess that is why economists are not usually considered romantics….
Consumer Price Index
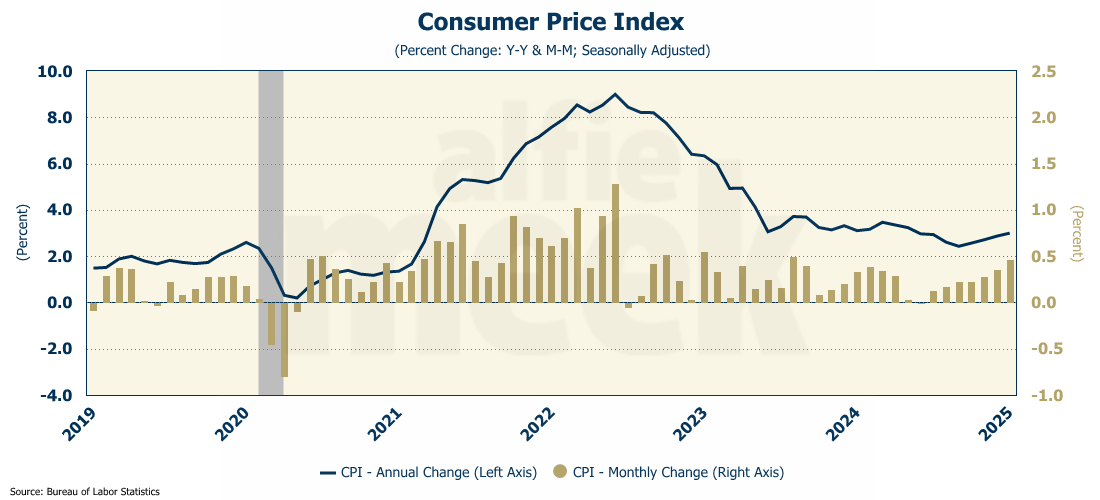
I hate to say “I told you so” but…I TOLD YOU SO! (Actually, I love saying “I told you so” because it means I was right when everyone else was saying I was crazy.) Yes, inflation is still a problem, and in January, it rose 0.5%, which is the biggest monthly increase since August 2023 (full release here). On a year-over-year basis, inflation rose to 3.0%. Core CPI (CPI less food and energy) jumped 0.4% in January (higher than the 0.3% expected increase), which drove it up to a 3.3% year-over-year rate. Super Core (core services less shelter) grew at a month-over-month rate of 0.7% - the fastest since 2022 - and it is still above 4.0%.

Inflation is obviously accelerating. On a month-over-month basis, it has risen seven straight months, and each month, it grows at a faster rate.
If I have said it once, I have said it a thousand times: inflation is everywhere and always a monetary phenomenon. (Actually, Milton Friedman said it, but I have repeated it…a lot.). The money supply is currently growing at 3.9% and accelerating. Inflation isn’t going anywhere but up, and as I have said for a while, the Fed is DONE cutting rates.
Unfortunately, current inflation continues to follow the pattern of the 1970s. History doesn’t always repeat, but it sure rhymes. And the Fed seems reluctant to do what they know needs to be done.

Producer Price Index
Producer prices also came in hotter than expected but the increase was not as dramatic as CPI (full release here). The final demand PPI rose .04% in January, more than the 0.3% that was expected. That brought the year-over-year rate to over 3.5% - the highest it has been in nearly 2 years. This was the 13th consecutive month of month-over-month increases in PPI.
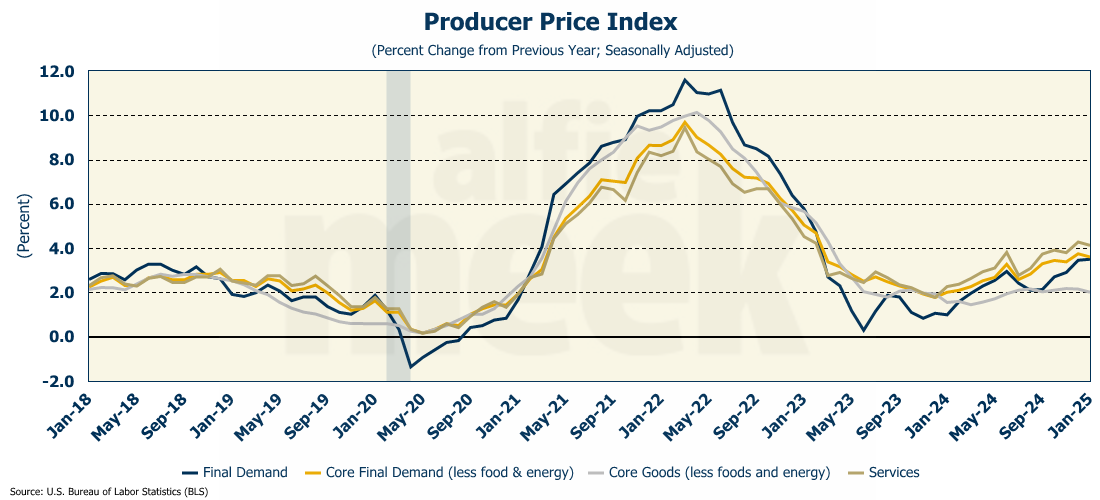
Core PPI also rose more than expected (0.3% vs. 0.2%), which pulled prices (less food and energy) up to 3.6% year-over-year. Services PPI dropped slightly but is still running above 4%. Over one-third of the rise in service prices was due to prices for traveler accommodations, which grew 5.7% in January.
Between the CPI and PPI results, you have to wonder at Fed Chair Powell's comments this week that inflation expectations “appear to remain well-anchored.” Seriously? That must be his way of saying, “don’t believe your lying eyes.”
Small Business Optimism Index
The National Federation of Independent Businesses (NFIB) published the January Small Business Optimism Index, showing a slight decline in January after significant increases over the two months (full release here). Following the November election, small business optimism surged due to expectations of lower energy costs and fewer regulations. This uptick followed a common pattern, as the index typically rises sharply after a Republican presidential win. However, in January, the index lost some ground, with over a third of small businesses indicating difficulty in filling positions, and the proportion of owners anticipating economic improvement dropped by five points. The primary factor contributing to this decline was the rise in the “Uncertainty Index,” which increased by 14 points to the third highest level ever recorded. In short, all the uncertainty swirling around in the economic and political environment right now is giving small business owners a slight pause.

Retail Sales
This morning, we got revised data on December retail sales, and it now looks like December was better than previously reported. Total retail sales were up 0.7% over November, and the rate of growth has increased now for three consecutive months (full release here).

On a year-over-year basis, nominal retail sales were up 4.4% over December 2023. That was the best number for the entire year. However, adjusted for inflation, while still positive, retail sales were only up 0.8% from one year ago. That is a decrease from the November rate and reflects the uptick in inflation.

Industrial Production & Capacity Utilization
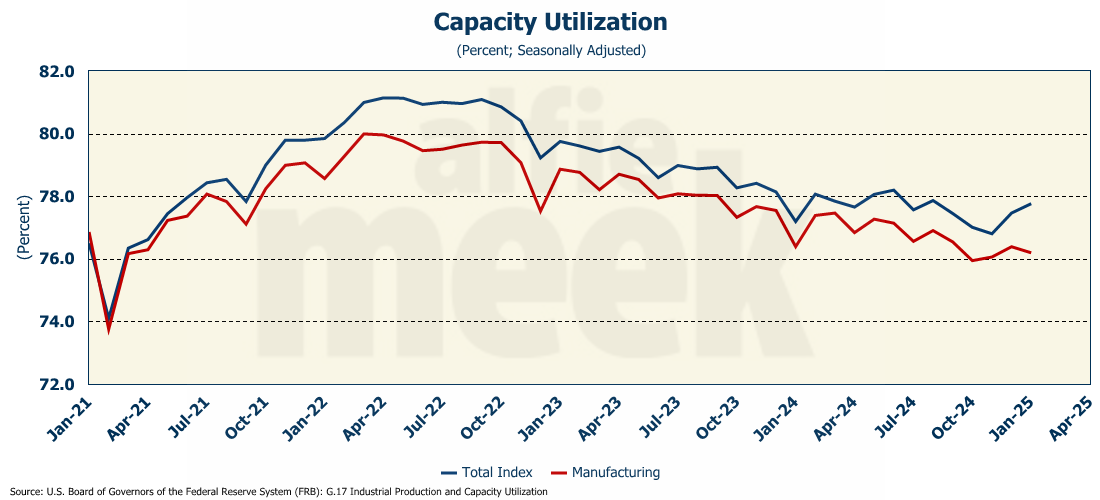
Industrial production increased in January for the second month in a row, rising 0.5% over December. That put total production 2% higher than last year (full release here). However, manufacturing output (which represents about 75% of total industrial production) contracted in January, falling 0.15%. That of course, means that something else had to pick up the slack. And that something would be utilities, which grew 7.2% in January, the most in three years. (It might have something to do with the extremely cold temperatures in January.)

Total capacity utilization also improved in January, rising for the second straight month. However, as with production, manufacturing capacity utilization fell slightly.
January Employment - Additional Thoughts
Finally, this week, I wanted to briefly revisit last Friday’s employment report. As I mentioned last week, the report contained major annual benchmark revisions to the data for the previous several years - back to April 2023 for the not seasonally adjusted data and back to January 2020 for the seasonally adjusted data. According to the Bureau of Labor Statistics (BLS):
"on a not seasonally adjusted basis, the total nonfarm employment level for March 2024 was revised downward by 598,000, or -0.4 percent. Not seasonally adjusted, the absolute average benchmark revision over the past 10 years is 0.1 percent."
Understand what that means. Over the last ten years, the average annual benchmark revision has been UP 0.1%. This time, it was DOWN 0.4%. They were WAY off. As a result, the over-the-year change in payrolls for March 2024 was revised DOWN more than half a million jobs.
Where you can really see the revisions is in the monthy data. The average monthly increase for 2022 dropped from 441K to 380K (-14%); for 2023, it dropped from 231K to 217K (-6%); and for 2024, it dropped from 186K to 166K (-11%). Notice they all were revised down…by a lot! The 2024 payroll numbers are made worse by the fact that we now know, right in the heart of a presidential election, June, July, August, and October were all sub-100K readings. That certainly would have changed the narrative about the “strength” of the job market and the overall economy.
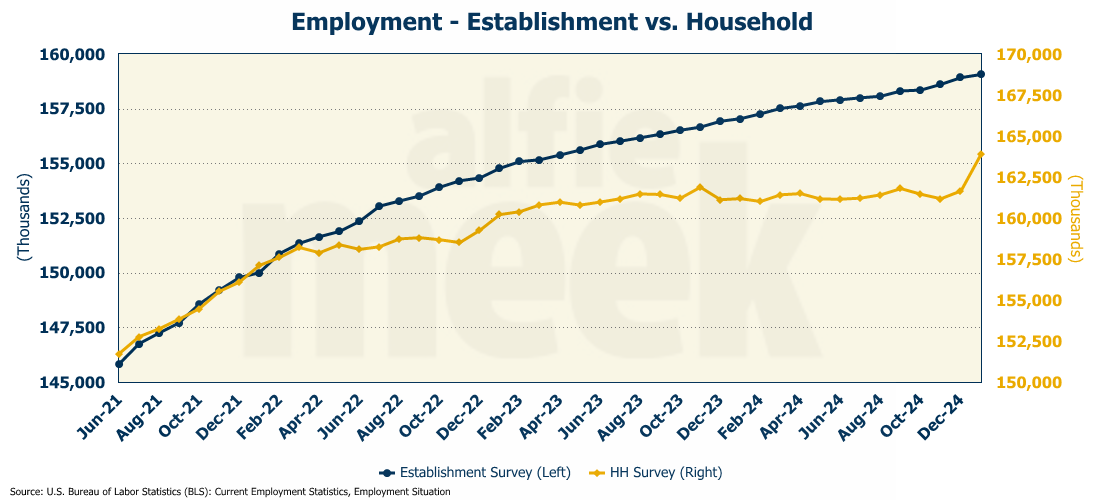
That is just the establishment survey. The household survey is even worse. The BLS just added 2.2 million household jobs to the employment number. Poof! There they are in January. Like magic.
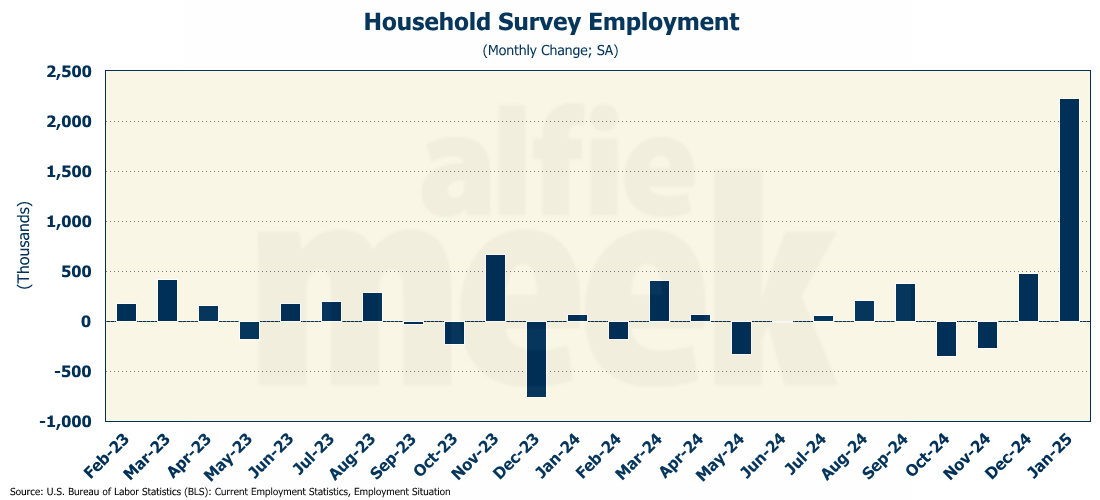
Here is how the BLS explained it….
“…for January 2025, updated population estimates were incorporated into the household survey. Population estimates for the household survey are developed by the U.S. Census Bureau. The change in population reflected in the new estimates results from adjustments for net international migration, updated vital statistics on births and dealths, and improvements in estimation methodology.”
I see. It is the Census Bureau’s fault! They apparently underestimated net international migration (can’t imagine why) PLUS, they apparently just discovered some new magical type of statistical estimation methods that were not previously known. I guess someone will soon be receiving the Rousseeuw Prize for Statistics for this new scientific advancement.
Then, they proceeded to state the obvious:
”This year’s adjustment was large relative to adjustments in past years. It reflects both updated methodology and new information about net international migration in recent years.”
Well, thank you. Glad we cleared that up.
But here is the best part. Unlike the establishment survey, they aren’t even going to try to go back and adjust the historical data. Nope.
“BLS did not revise the official household survey estimates for December 2024 and earlier months.”
That’s just great. So, we will not be able to do any good analysis of the household data for the last several years. Further, the massive gap between the reported payroll number and the household number (which I have commented on several times) was closed by half.
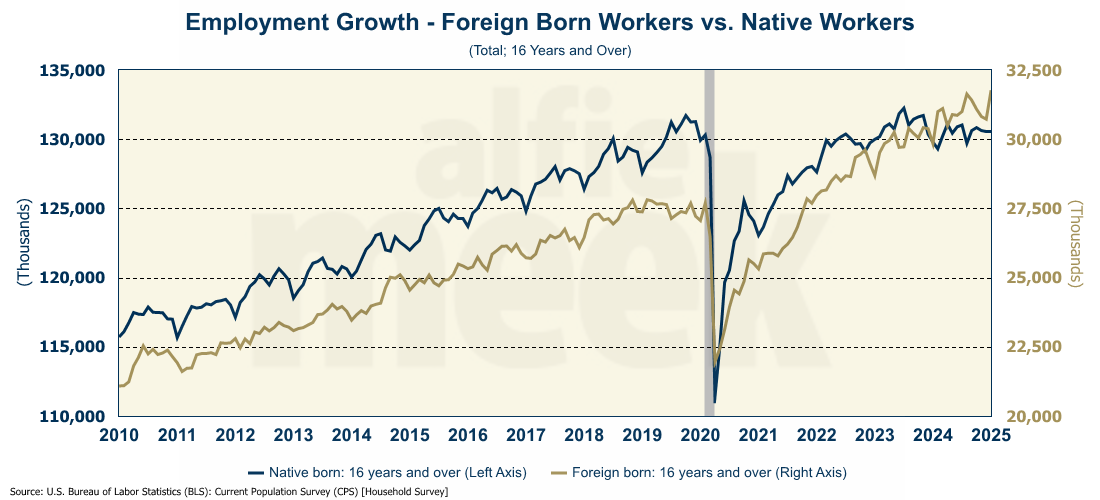
And the reason? By their own admission, it is largely due to the fact that the Census Bureau just discovered that there are millions of foreign workers in the US…a fact made clear by the revisions to the foreign-born worker data. According to the new data, the level of foreign-born employment is up 4 million since pre-COVID. The level of native-born employment is up only 245K.
Analyzing the macroeconomy is hard enough. When statistical agencies do their job this poorly, it makes it almost impossible.
One More Thing…
I want to thank all my “bronze” level members who subscribe and help support this effort. Dave Gmeiner, Steve Goins, Colin Martin, Brad Wood, Tommy Jennings, Carlos Alvarez, Chad Teague, Andrew Imig, and someone with a “GTwreck” e-mail! Thanks for all your support!
If you find this update useful/interesting, I invite you join this group and click/scan the QR code below to join or just “buy some coffee” in support of this effort.