
Weekly Economic Update 03-28-25: Income Tax; New Home Sales; Consumer Confidence; Durable Goods; Personal Income & Spending; and PCE Inflation
Inflation ticks back up as the manufacturing recovery continues.
The views and opinions expressed in this post are solely those of the author and do not necessarily reflect the views of the Georgia Institute of Technology or the Georgia Board of Regents.
Based on data provided by Substack, most of you reading this are located in the southeastern United States, as am I. Last weekend was absolutely beautiful here. Warm weather, blue sky, trees and plants beginning to bud, and of course, pollen…lots and lots of pollen. Spring has finally arrived.
I don’t know how you spent last weekend, but let me tell you how I spent mine…at my dining room table, doing my taxes. And that has put me in a rather sour mood. With the April 15 deadline approaching, I thought I would do something a little different and share some history and facts about the income tax.
Prior to the Civil War, the federal government relied on excise taxes (i.e., sales taxes on tobacco, alcohol, sugar, etc.) and tariffs on imported goods to fund its expenses. (Huh….tariffs to fund the government…what an interesting idea…..)
However, war is expensive, so, in clear violation of the U.S. Constitution, the northern states enacted an income tax in 1861 - 3% on income more than $800. It didn’t generate enough money, so they passed another one in 1862 at 3% with a top rate of 5% on income in excess of $10,000. The tax expired in 1872 after raising about $376 million for the war effort, or 20% of the total federal revenue raised during that period.
Again, this income tax was unconstitutional, which they found out in 1894. The temptation for easy money was just too great, so they passed another income tax in conjunction with lowering tariffs. It was 2% on income above $4,000. People were willing to look the other way during wartime, but not a second time. Because an income tax violated apportionment (i.e., revenue from states would NOT be in proportion to their population), it was in violation of the Constitution. In 1909, President William Howard Taft agreed to accept a tax on corporate income (not subject to the constitutional requirement of appropriation because it was considered an indirect tax) if Congress would propose an amendment for the national income tax. That gave us the 16th amendment to the Constitution:
“The Congress shall have power to lay and collect taxes on incomes, from whatever source derived, without apportionment among the several states, and without regard to any census or enumeration.”
In 1913, Wyoming became the 36th state to ratify the 16th Amendment. The initial LEGAL income tax was 1% on incomes above $3,000 ($4,000 if married) with a top surtax of another 6% on incomes above $500,000. Only 1% of the population was subject to the tax, and 378,598 returns were filed with an average tax paid of $78. Interestingly, ALL 378,598 returns were audited.
Then came World War II. And once again, war is expensive. So, the taxable level of income dropped to levels earned by ordinary households.
1939 - 7.6 million returns filed, yielding $1 billion
1945 - 49.9 million returns filed, yielding $19 billion
Until 1944, the corporate income tax had exceeded the individual income tax in just about every year. However, since 1944, individual income tax has consistently exceeded corporate income tax collections. In FY2024, total individual income tax collections were $2.4 trillion. Corporate income tax was only $530 billion.
According to data from the IRS, the top 20% of filers paid more than 81% of that total, or roughly $1.9 trillion. (To be in that top 20%, you have to make at least $130K.)
The top 1% paid more than 36%, or more than $870 billion.

We hear a lot about how the “rich don’t pay their fair share,” but no one ever says what their “fair share” actually is. I’ve never once heard a number. Clearly, it must be somewhere north of 36.8%. But how far north? 50%? 75%? How much is enough? No one will ever say.
Here’s the problem. Not that 1% are paying 36.8% of the tax, but that 40% aren’t paying anything. If you broke this down into deciles, the number is closer to 50%.
As I have been pointing out for months, the U.S. is broke. The red outline below represents $2 trillion. The current budget deficit is $2.5 trillion, but $2 trillion is the DOGE goal for cost cutting. The solid red square represents $165 billion…DOGE’s current level of cuts by their own accounting/reporting. They have a long way to go.

And it should be clear from the above that to get $2 trillion, you have to make changes to entitlement programs. But that is hard to do when half the population doesn’t have any skin in the game. You can’t have a well-functioning, fiscally responsible democracy when half the people can vote themselves benefits that are paid for by the other half. Our $36 trillion national debt is proof positive of this. Something has to change, and some tough choices have to be made.
New Home Sales
After a poor showing in January (supposedly due to the weather), new home sales in February came in lower than expected, growing only 1.8% for the month (full release here). However, on a year-over-year basis, new home sales are up 5.1%.

The median price of a new home fell slightly to $416,324 (seasonally adjusted), which is a drop of 1.3% from a year ago. The total supply of new homes for sale jumped 0.8% to 500K units - the highest level since 2007. Completed inventory also rose to 121K units. At the current sales rate, there is an 8.9 month supply of new homes. As I have said a lot recently, the issue with housing is not longer supply, it is affordability. With this much supply, housing construction should slow this year.

Consumer Confidence
Last week, we discussed the University of Michigan consumer sentiment numbers. They are falling, but that sentiment is being highly influenced by partisan politics. This week, we got data on March consumer confidence from the Conference Board, and like the consumer sentiment numbers, confidence is dropping significantly (full release here). In fact, expectations for the next six months dropped almost 10 points to 65.2, the lowest level in 12 years. Consumer confidence overall fell more than 7 points below a range in which it has been fluctuating in since 2022.

Looking at the monthly changes, overall confidence has fallen every month since the election, and each month, the decline has gotten larger. Of the five sub-components, only one - assessment of the present labor market - rose. Consumers’ optimism about their future income, which has been holding up nicely, disappeared. In addition, consumers turned negative about the stock market - the first time that has happened since late 2023. No doubt this was in response to recent declines.
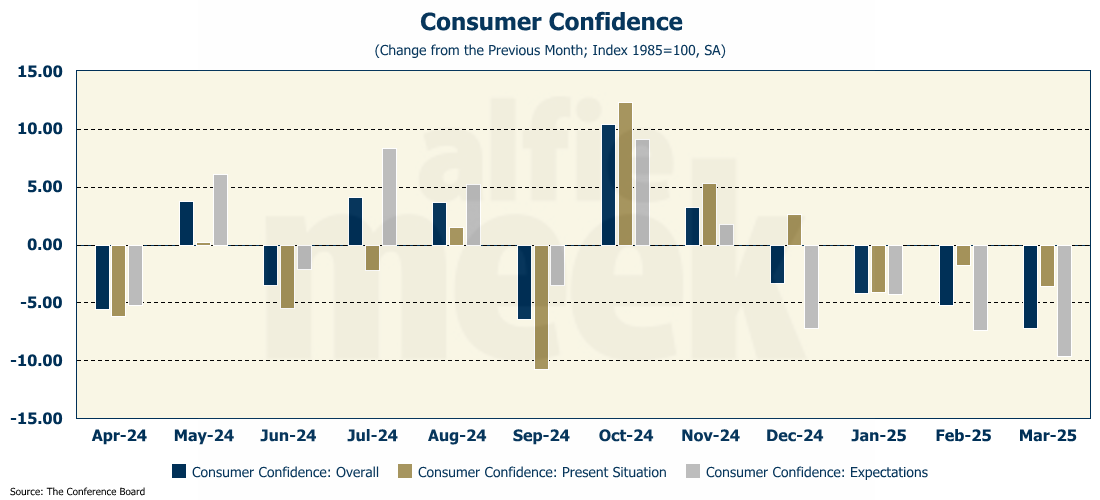
Unfortunately, the Conference Board doesn’t provide data on political affiliation, but one might expect that similar forces impacting consumer confidence are also impacting consumer sentiment. However, if we use state-level confidence as a proxy (California & New York for “blue” and Texas and Florida for “red”), only Texas is showing an increase in confidence. Perhaps the Conference Board survey is more broad-based and less subject to political opinion.

Durable Goods
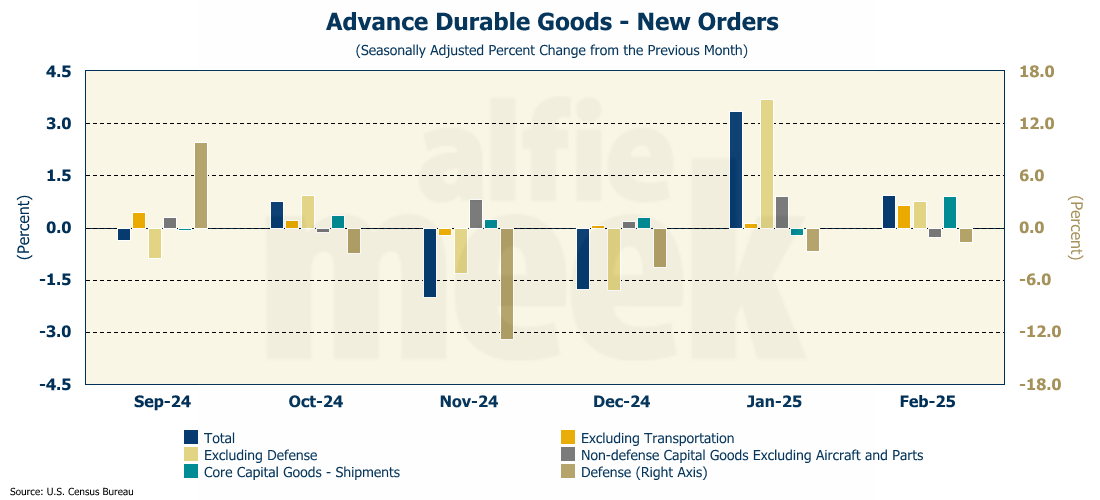
Durable goods orders were expected to fall by 1% in February after their strong showing in March. However, rather than fall by 1%, they grew by almost 1%, even after the January number was revised higher (full release here). Overall, durable goods orders were up 0.9% in February and 3.4% on a year-over-year basis. Core durable goods orders - durable goods less transportation - jumped 0.7% in February which was the largest monthly increase since March 2022. Even more importantly, core capital goods shipments, a measure used to calculate equipment investment in GDP calculations, rose 0.9% - the most in a year. Hard to see how there can be a recession on the horizon with the recent recovery in manufacturing.
Personal Income & Spending
This morning, we got the February read on personal income and spending (full release here). On a nominal basis, personal consumption rose 0.4% in February and was up 5.3% over last year. However, adjusted for inflation, they were only up 0.1% and 2.7% over last year.
Personal income performed much better, rising 0.8% in nominal terms, which was an increase of 4.6% over last year. Expecatations were for growth of only 0.4%. Adjusted for inflation, the numbers were 0.5% and 1.8%, respectively.

So, the bottom line is that for the second consecutive month, income grew faster than consumption, which raised the savings rate to 4.6%. That is great for household balance sheets. However, given that personal consumption is just about the only thing keeping the economy afloat right now, it does not bode well for 1st quarter GDP.
As I have written previously, high-end consumers have been spending like crazy due to their perceived wealth effect. With the market taking a hit and real estate prices stabilizing, that wealth effect is waning. If it doesn’t return, the long anticipated end to the consumption party may finally arrive.
PCE Inflation
Finally, this week, we got the February read on PCE inflation - the preferred inflation measure of the Fed. Expectations for total PCE were for a monthly increase of 0.3% and a year-over-year rate of 2.7%, and that is basically what we got. However, the core PCE (PCE less food and energy) came in higher than expected at 0.4% month-over-month and 2.8% year-over-year. For both measures, that is an increase in the annual rate of inflation. If you annualized the monthly rate for February, you would be looking at an annual rate of 4.5%.
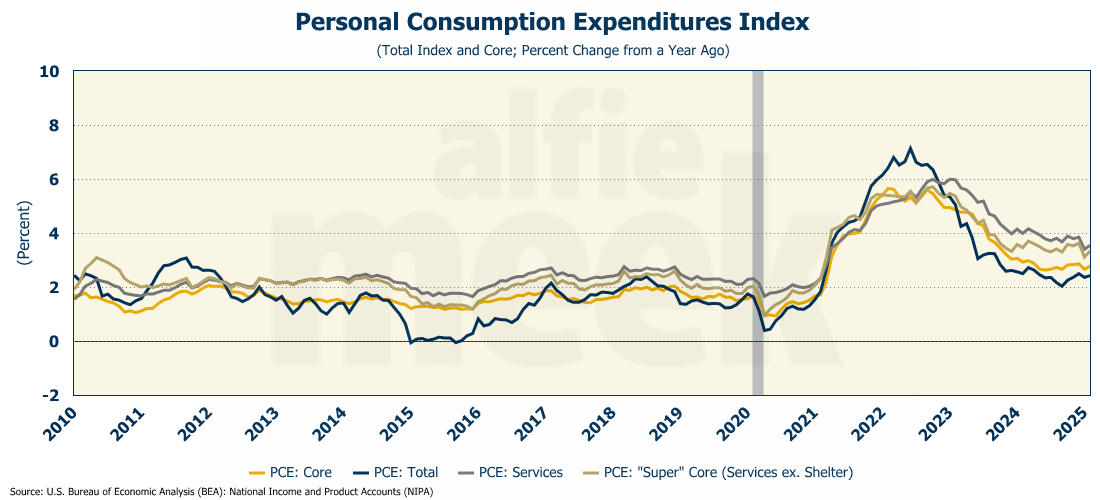
PCE for services and “Super Core” (services less shelter) also both ticked back up in February. It is becoming even more clear that the Fed should not have cut rates as aggressively as they did last year, and I continue to believe they won’t cut rates at all this year. The market seems to still be expecting a rate cut in June. That is simply not going to happen. Inflation is clearly sticky and not coming down, and further rate cuts will only make the problem worse.
One More Thing…
What a great time yesterday at the Partnership Gwinnett Economic Outlook! Thanks to Partnership Gwinnett and the Gwinnett Chamber for hosting me. More than 200 people showed up, and I stayed for an hour afterward, talking to people and answering questions. I hope everyone there enjoyed the event. I had a great time, and I look forward to doing it again next year!
After the event yesterday, we have a lot of new subscribers. As always, thank you for subscribing and reading this weekly update. If you find it informative, I invite you to click/scan the QR code below to join as a “member” or to buy a coffee or two (or five) and support this effort.