Weekly Economic Update 08-30-24: Jackson Hole; New Home Sales; Case-Shiller Home Price Index; Durable Goods; Consumer Confidence; Personal Income & Spending; PCE Inflation; and Revised GDP
The views and opinions expressed in this post are solely those of the author and do not necessarily reflect the views of the Georgia Institute of Technology or the Georgia Board of Regents.
Last week was the Federal Reserve held its annual “premier” central banking conference at the Jackson Lake Lodge in Grand Teton National Park in Jackson Hole, Wyoming. The conference is invite-only and includes global central bankers, invited academic economists, and other distinguished guests. (Unfortunately, I have never been invited, but hope springs eternal.)
One of these distinguished guests was Karen Dynan, an economics professor at Harvard University, who very clearly assured everyone in attendance that the economy would not fall into recession. Dynan said, “when we enter the typical recession, there is usually some underlying weakness. It just doesn’t feel that way now.”
Really? It “doesn’t feel that way now.” Huh. So, to be clear, the fact that manufacturing has been in contraction for 2 years; that the yield curve has been inverted for 2 years; that the leading economic index has been falling for 2 years; that we over-stated employment by nearly 1 million for the last 18 months; that business investment is declining; that real retail sales have been mostly negative for the last two years; that the number of new mortgage applications is at 1994 levels; that federal debt is exploding; that GDP is slowing; and that the unemployment rate is rising doesn’t feel like “underlying weakness?” Kind of seems like the definition of “underlying weakness.”
Ms. Dynan did admit that, in the past, such an increase in the unemployment rate as we are seeing now has often portended a recession, but “this time is different.” Oh! I see! THIS time it’s different! That’s good to know, because it kind of feels EXACTLY like a recession. (But then, this is why I am not invited to parties or fancy economic conferences in Wyoming.)
Something else I found interesting that came out of Jackson Hole last week.…..according to the Fed, if the economy is “steady” (defined as 2% inflation and 2% economic growth) the benchmark Federal Funds rate should be at 2.8%. Really? Well, if that is the case, one is left to wonder why they kept the rate at virtually ZERO for six years between 2010 - 2016 when inflation was actually running slightly under 2% and GDP was averaging 2.5% for the period? I mean, by their own definition, the economy was steady and the rate should have been around 2.8%. But instead, they kept the rate at zero, made money virtually free, and caused a massive misallocation of capital, the effects of which we are still dealing with today.
Durable Goods (Advance Report)
The advanced report on durable goods orders for July showed an increase of 9.9% month-over-month, nearly twice the rate that was expected! That is the largest monthly increase since the post COVID-lockdown bounce in July 2020 (full release here). However, the entire increase was driven by transportation orders. If you take out transportation order, durable goods actually fell 0.2% in July. On an annual basis, orders less transportation are up only 0.6% over 2023.
Despite the one-month jump, output in the manufacturing sector is not keeping up with overall economic growth. Further, companies are not placing orders for new business equipment. Reasons could include financing costs, concerns about the economy, or both. Whatever the reason, companies are being careful about investment, and historically, when business investment turns, it is an indicator of recession.
Gross Domestic Product - 2nd Quarter (Revised Estimate)
Well, in Ms. Dynan’s defense, while it may feel like a recession, according to the Bureau of Economic Analysis (BEA), we certainly weren’t in one in the second quarter. According to the BEA, the economy grew at an annual rate of 3.0% between April and June! That is higher than the preliminary estimate of 2.8% released last month (full release here).
The additional growth was the result of….you guessed it….personal consumption. In the advanced report, personal consumption represented about 1.5% of the 2.8% growth. In this latest release, it jumps to nearly 2.0% of the 3.0% growth.
Remember, this is REAL GDP, which means it is adjusted for inflation. Two weeks ago, I pointed out that REAL retail sales have been NEGATIVE for most of 2024, and were quite negative for all three months of the 2nd quarter. So, how then is it that REAL personal consumption grew so much in the 2nd quarter?!? The answer, obviously, is that we consume more than retail goods. We also consume services. In fact, about two-thirds of personal consumption is services. In this report, the leading contributors to the increase in services consumption were health care, housing and utilities, and recreation services.
But wait! According to the CPI, core services inflation is running at 4.7%! So, if it was services driving the growth, then we had to really spend a LOT on services! According to the BEA, we spent 7% more (nominally) on services in the 2nd quarter of 2024 than we did in the 2nd quarter of 2023. Adjust for 4.7% services inflation, and you still have 2.3% real growth in service consumption!
As I have said many times…the U.S. consumer seems to have an unlimited ability to spend money. You have to wonder when it will come to an end. But even if it does, with the government deficit running at more than 8% of GDP, it is hard to imagine how we get a recession with that level of excessive government spending.
New Home Sales
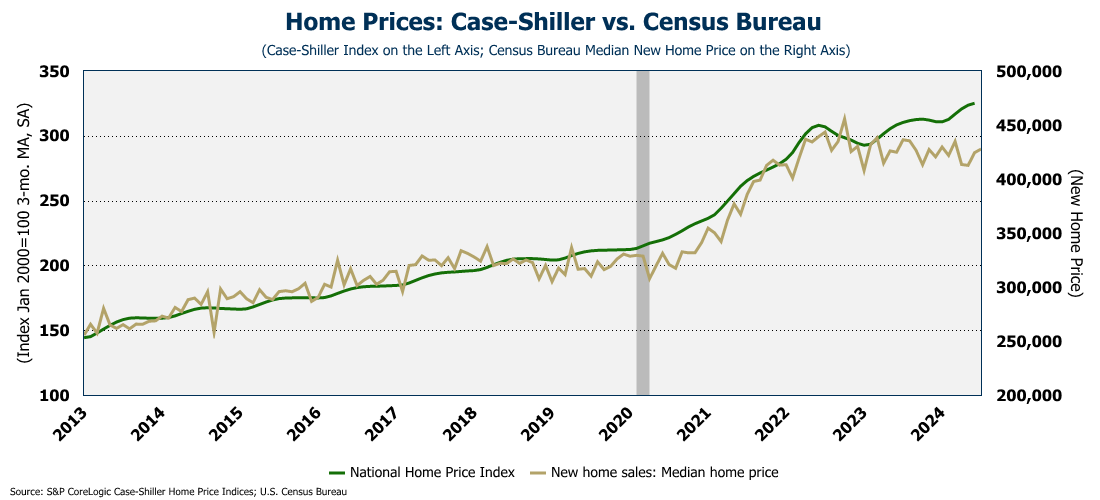
Surprisingly, new home sales jumped 10.6% in July to a level not seen since May 2023 (full release here). That jump puts them at 5.6% above the level of last July. With existing home owners reluctant to put their homes are the market, the demand has to be met with newly constructed homes. Even so, sales have been fluctuating around the 674K unit level for the past 12 months, well below the peak of more than 1 million annual units we saw in mid-2020. The median price for a new home ticked up slightly and now sits at about $428K.
Case-Shiller Home Price Index
The Case-Shiller Home Price Index (which lags considerably) confirmed what we already knew…that home prices rose in June - setting another record high - and in particular, were up in the 20 major metro areas around the country (full release here).
The 20-city index rose 0.4% in June and was up 6.4% year-over-year. That is slower than the 6.8% annual growth posted in May, but it is still significant growth, that is far out-pacing the growth in income. Even so, it is worth noting that the pace of growth has now slowed for three consecutive months.
Interestingly, the median price of a new home (which we discussed above) are starting to diverge from the Case-Shiller Index. Of course, one is for new homes, and one is for all homes, but historically, these have moved together.
Consumer Confidence
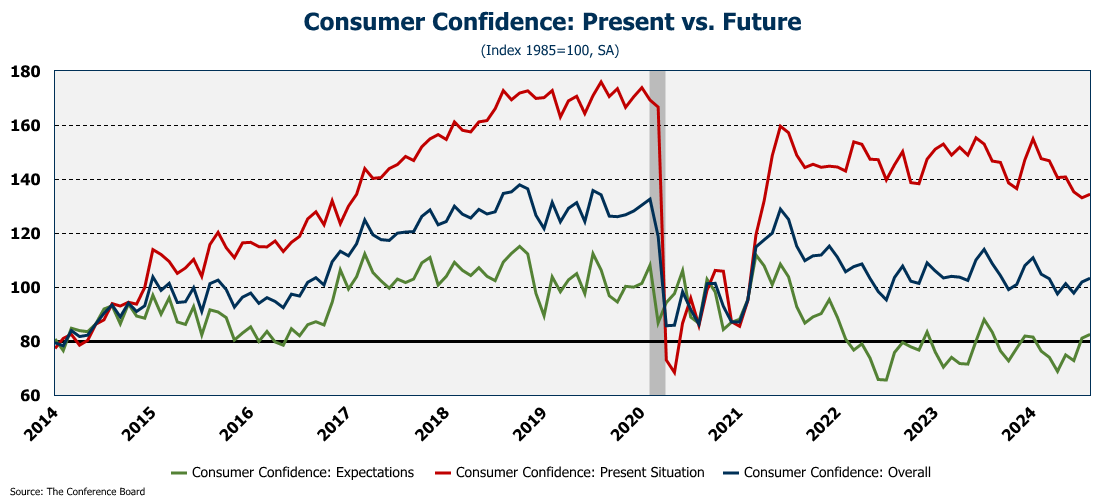
Consumer confidence came in considerably higher in August than was expected with the headline number rising to 103.3 (full release here). Further, after revising 8 of the previous 9 months down (as has been the norm in recent years) the July consumer confidence number was actually revised up! (I am always curious about revisions to consumer confidence surveys…how does that happen? Do people decide they made a mistake and they were actually more/less confident last month than previously reported?)
This is the highest reading since last February and was driven by increases in both confidence in the present and the future. Overall, consumer confidence has been moving up recently, especially confidence in the future, although the index is nowhere near the levels it was pre-COVID.
But as I reported last month, neither the increase in present confidence nor the increase in the expectations index seem justified when you start asking people about their future spending plans. Every major category of spending - cars, homes, major appliances, vacations - dropped in August, as did consumers feelings about the availability of jobs. Clearly I need to learn more about how this index works because one would think that if consumer’s confidence was rising, so to would be their plans to spend money. My only guess is that they are feeling good about the economy, but they are simply tapped out and about to put the brakes on their spending. But that isn’t the norm for the U.S. consumer.
Personal Income & Spending
And the spending data this morning proves it isn’t the norm. Personal spending in July was up 0.5%, the fastest rate since March (full release here). Unfortunately, personal income was up only 0.3%. Once again, consumption outpaced income. As a result, the personal savings rate dropped to 2.9%. That is the first time the savings rate has dropped below 3.0% since June of 2022.
With prices still rising; consumers still spending; and incomes not keeping up, the savings rate is likely to continue to decline as we enter the fall.
PCE Inflation
Speaking of prices, this morning we got the Personal Consumption Expenditure (PCE) measure of inflation which is the Fed’s “preferred” measure. And this is the last reading of PCE we will get before the next Fed meeting. The July PCE came in at 2.5%; core-PCE at 2.6%. (The core measure removes food and energy.)
Those numbers sound good. Here is the problem. It is hard to see it on the graph, but for both PCE and core PCE, the number was a little higher than last month! Not by a lot, but the move was in the wrong direction! In fact, if you annualize the monthly growth in PCE, it increased for the third consecutive month. And that isn’t surprising when you look at the growth in the money supply which has started moving up again and is still way above trend.
Service inflation came in at 3.7%, slightly down from last month. So-called “Super Core” came in at 3.3%. Both were down from June, but both are still running way too high for the Fed to consider cutting rates. But they will cut rates. Because of their “dual mandate” of stable prices and full employment. The labor market is weakening and they feel like they have to move despite the fact that inflation is not beaten. And as a result, a second wave of inflation is very likely.
Final Thoughts
Next week I will be traveling but I still plan to still publish the update. The big news next week is the August employment report which will be out next Friday morning, so if I do manage to get the update published, it may not be until late Friday afternoon. Whenever it comes out, it will include some fun election economic analysis that you may not have seen before.
Once again, thanks to all those who are supporting this effort through the “buy me a coffee” link below. This week’s contributors included Sue Wyatt, Thomas Smith, John Knight, and some others whose names were not attached to their contribution. If you find this weekly update useful and would like to help support this work, please click image below.
Or, even better, go ahead and commit to an $8 monthly subscription! My plan is to move to a subscription model sometime in October, and knowing in advance how many people are willing to support this effort will help me plan as I move forward.
Have a great Labor Day weekend!


