
Weekly Economic Update 12-13-24: Consumer Price Index; Producer Price Index; Federal Spending; and Consumer Credit
The cost of Christmas cookies is rising as inflation continues to accelerate, but the Fed just doesn't care
The views and opinions expressed in this post are solely those of the author and do not necessarily reflect the views of the Georgia Institute of Technology or the Georgia Board of Regents.
Not much economic data to report on this week. However, what we got was significant as the latest readings on inflation - measured by the consumer price index and the producer price index - were released. Also, because of all the inflation data, I am back to using “!” this week. (Last week’s post seemed a little dry without them and we had a few readers actually unsubscribe!)
Consumer Price Index
First, on Wednesday, we got the consumer price index (CPI), and once again, it rose from the previous month (full release here). If you have been reading this blog regularly, this should not be a surprise. Month-over-month, headline CPI was up 0.3% and 2.7% year-over-year. That is up from 2.6% last month.

Once again, we see that the historical trend is holding. When you see a spike of inflation of 9%, there is nearly always a second wave that follows shortly thereafter. You can see the second wave starting to develop as the trend looks eerily like the late 19070s to early 1980s.

Digging into the details, we see that once again, food and shelter lead the way on the headline number. Shelter rose 0.3% in November, and accounted for almost 40% of the monthly increase. And if you went shopping for your Thanksgiving meal a couple of weeks ago, or if you are getting ready to make all your Christmas goodies, you are seeing food inflation every trip to the store. The food index rose 0.4% in November, and “food at home” was up 0.5%.
Earlier this week, I came across this article by Charles Marohn, who created his “Christmas Cookie Inflation Index” (CCII) five years ago to track the change in a basket of goods used annually in making his Christmas cookies. His CCII is below:
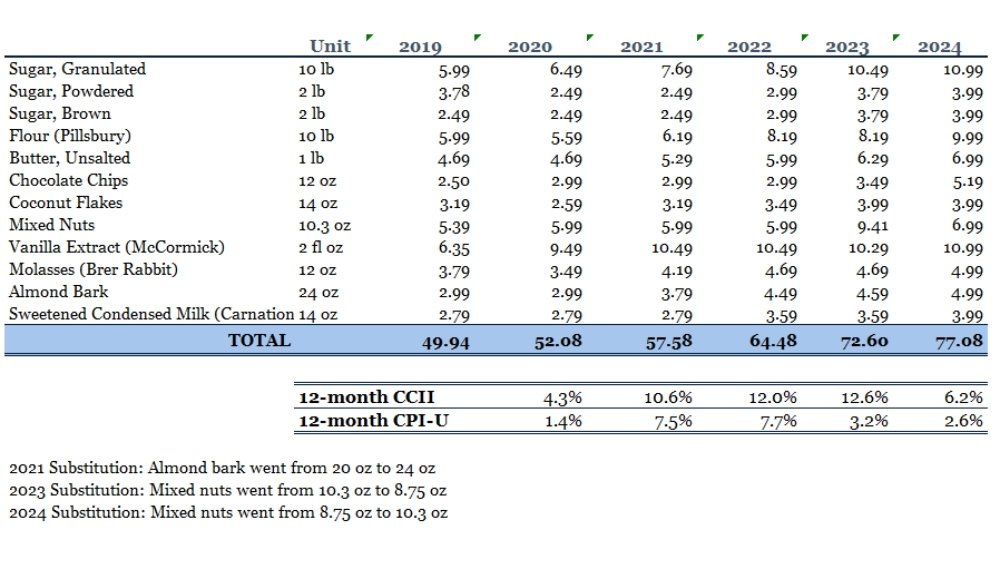
To be fair, it isn’t technically an “index” but his point is well made. Since 2019, the cost to make his Christmas cookies (using the same basket of goods) is up 54.3% while the overall CPI is up 20% and the food index is up 23%. Making Christmas cookies has become an expensive proposition.
The irony is that if you remove food from the index, as well as energy, you get Core CPI which is also trending up and is running even hotter at 3.3% year-over-year. But even that is only because there is currently DEFLATION in energy and that is holding overall CPI back. Were it not for energy, overall CPI would be running much hotter.
So, this begs the question….under what framework is the Fed operating? They plan to cut rates later this month, in an environment with strong GDP, record-setting stock market, and rising inflation. I just don’t understand.
Producer Price Index
If consumer prices are heating up, producer prices are red hot! Thursday, we got the latest data on the Producer Price Index (PPI) which measures prices at the wholesale level and they came in much hotter than expected (full release here). Headline PPI was expected to increase 0.2% in November, but came it twice that at 0.4%. That translates to 3.0% on a year-over-year basis which is the highest rate since February 2023. Core PPI came in at 3.5%, also the highest since February 2023.

The growth in the PPI has been accelerating over the past three months, and on an annualized basis is now growing at a rate of 4.6%! Keep in mind, these are prices at the wholesale level. PPI inflation tends to be a forerunner of inflation at the consumer level. There is simply no justification for a rate cut this month.

Federal Spending
In November, the federal government spent $668.5 billion. During the same month, the government only took in $301.8 billion, resulting in a monthly deficit of $366.8 billion dollars. So basically, the government spent 221% of the revenue they collected. Below, you can see the sources of revenue, and how the money was spent.
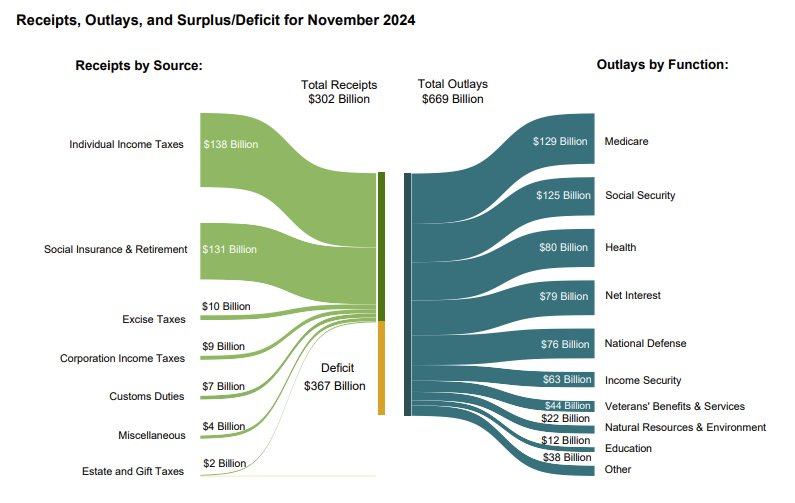
Compared to last November, spending on Medicare was up $50 billion - 63% higher than last year. Social security spending was up 7.7%, and defense spending was up 8.6%.
Now, in any given month, outliers could impact both sides of this equation. So, to get a better picture of the spending and revenue trends, I took a 6-month moving average of both. The graph below shows the results.

Basically, over the past 6 months, federal expenses have outpaced revenues by more than 55%. Over the past year, spending is up 15.8% while revenue is up only 6.4%. In fact, going back a little farther, you see that revenue is generally flat over the past three years while expenses continue to climb. Of course, the difference is made up of debt. One year ago, net interest expense was $72 billion. This November, that climbed to $80 billion. On an annualized basis, 3rd quarter interest payments exceeded $1.1 trillion.
This can’t continue. And I have said before, it doesn’t matter how much government waste Elon and Vivek can eliminate…the problem rests with major spending programs that are popular and politically hazardous to deal with. But if we don’t deal with them, it isn’t going to end well.
Consumer Credit
Last month, when the weak consumer credit data came out, I posed the question “is the consumer slowing down?” I went on to say that I have given up thinking so, and that it was “more likely they are just storing up for the Christmas season.”
It looks like once again, I was proven correct. (Although, to be fair, the easiest forecast in the world is that the U.S. consumer will spend money and go into more and more debt.) Consumer credit absolutely exploded in October rising more than $19 billion to a new, record-high level of $5.112 trillion.

Revolving debt (the bulk of which is on credit cards) rose $15.7 billion and now stands at $1.37 trillion. That was the single largest monthly increase in revolving credit since June 2022.

Of that, $1.37 trillion, credit cards make up $1.17 trillion. And, despite the Fed cutting interest rates, the interest rate on credit card debt continues to rise and now stands at 23.37% for cards carrying a balance.

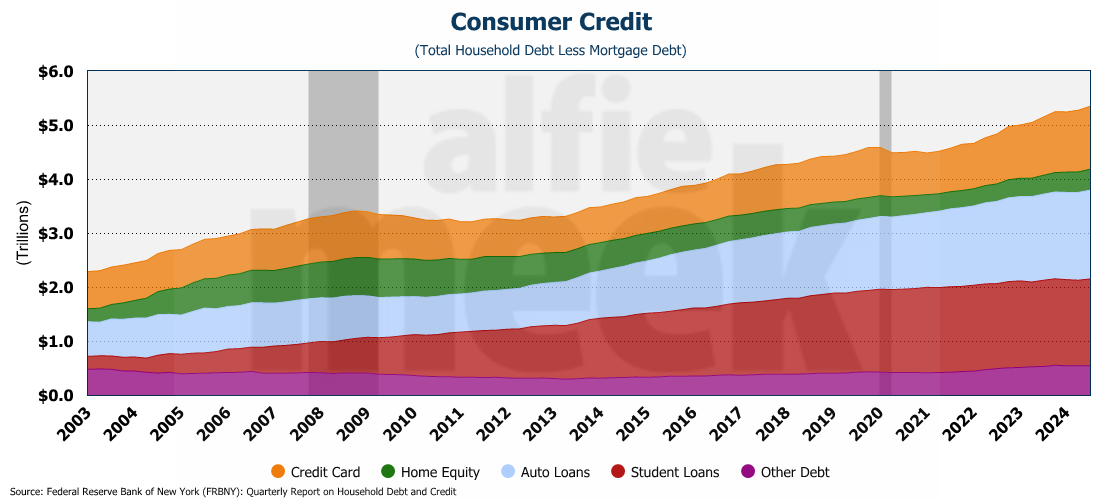
In addition to those credit cards, U.S. households are carrying $1.64 trillion in auto loans; $1.61 trillion in student loans; $387 billion in home equity lines of credit; and $546 billion in “other debt.” More than $5 trillion in outstanding consumer credit. This is, of course, on top of the $12.6 trillion in mortgage debt (but at least mortgage debt is theoretically backed with a physical asset.)
So, no….the consumer is not done spending. Will the household sector of the economy ever collapse under the weight of all this debt? Eventually it has to come to an end. But for now, I can’t wait to see the results of spending from this Christmas season.
One More Thing…
Speaking of the season, as we approach Christmas I again want to thank all my readers. I have now published this weekly blog for 71 consecutive weeks with no breaks, and the feedback and support have been amazing.
This year, I am going to take the week of Christmas off to spend time with my family and take a little break from economics. As such, I have invited a guest writer for the December 27th post. When I speak publicly, I often get asked about my thoughts on Bitcoin and other crypto currencies. I nearly always avoid answering those questions, so as not to give the impression that I am giving any sort of investment advice. I am not a trained investment professional and NEVER give ANYONE investment advice. So, I asked my guest writer for the week of Christmas to put together some thoughts on crypto. I’ll let him say what I won’t.
Once again, if you are reading and sharing this update weekly, I invite you to click/scan the QR code below and support this effort.

Also, please continue to share with your network. I am looking for a few more subscribers to hit a big milestone before the new year. Thanks again for all the support.